(Fedora: Lesson 13)
{ Setting up SAR (System Activity Reporting) }
| Section 0. Background Information |
- What is SAR?
- SAR is the system activity reporter.
- By interpreting the reports that sar produces, you can locate system bottlenecks and suggest some possible solutions to those annoying performance problems.
- The Linux kernel maintains internal counters that keep track of requests, completion times, I/O block counts, etc.
- From this and other information, sar calculates rates and ratios that give insight into where the bottlenecks are occurring.
| Section 1. Play the Fedora Virtual Machine |
- Play virtual machine. (See Below)
| Section 2. Login to your Fedora14 server. |
- Login As student
- Start Up A Terminal.
- Applications --> System Tools --> Terminal

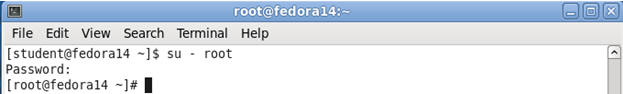
- Switch User to root
- Command: su - root
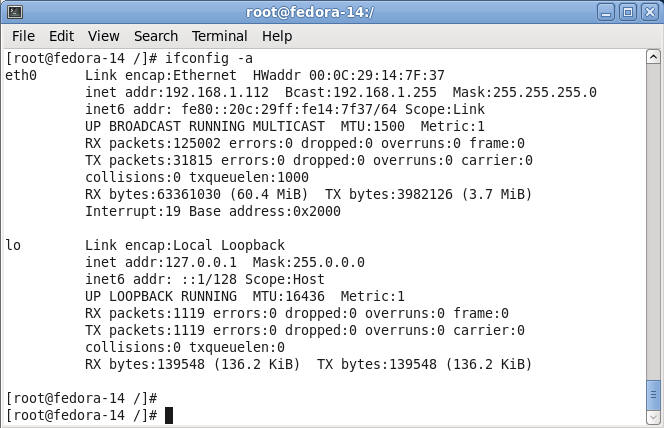
- Determine IP Address and Network Connection.
- Command: ifconfig -a
- Note: In my case, the IP Address is 192.168.1.112.
| Section 3. Installing SAR (sysstat) on Fedora14 |
- Install the SAR package called sysstat
- Command: yum install sysstat
- Install sysstat's rpm
- Command: Type "y", and hit enter
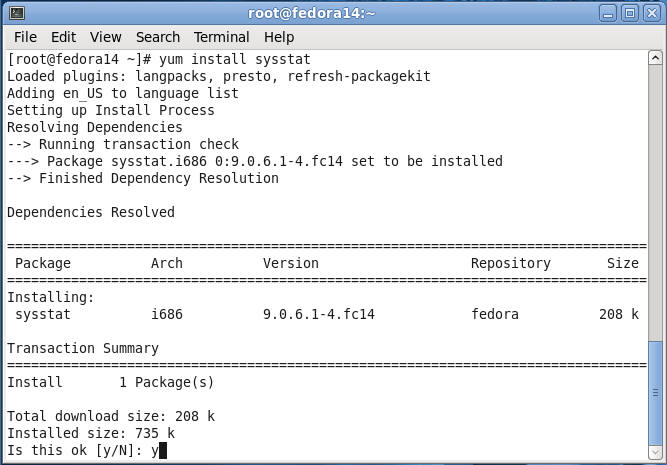
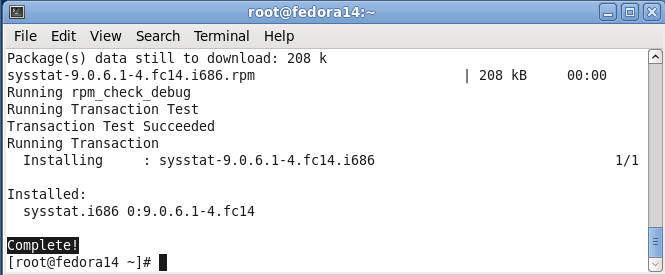
- Verify Installation Results
- Note: Just take note of what is getting installed along with the completion notice.
| Section 4. Initialize SAR |
- Initialize SAR
- Command: /usr/lib/sa/sa1 1 1
- Note:
- sa1 - Collect and store binary data in the system activity daily data file.
- The sa1 command collects and store binary
data in the /var/log/sa/sadd file, where the dd parameter
indicates the current day.
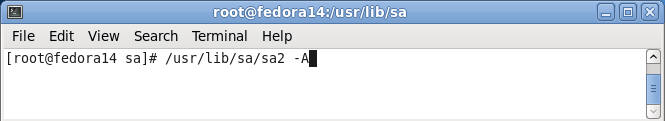
- Initialize SAR
- Command: /usr/lib/sa/sa2 -A
- Note:
- sa2 - Write a daily report in the /var/log/sa directory.
- The sa2 command is a shell procedure
variant of the sar command which writes a daily report in the
/var/log/sa/sardd file, where the dd parameter indicates the current day. The sa2 command handles all of the
flags and parameters of the sar command.
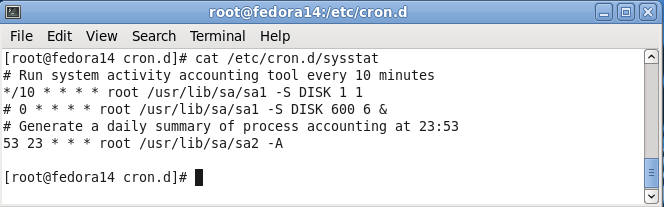
- Verify /etc/cron.d/sysstat was created.
- Command: cat /etc/cron.d/sysstat
- Note:
- The sysstat package create a crontab for sar called sysstat located in /etc/cron.d
- The first uncommented line (i.e., does not start with a #) tells cron to run sar every 10 minutes.
- The second uncommented line generates a daily summary for the accumulated sar data.
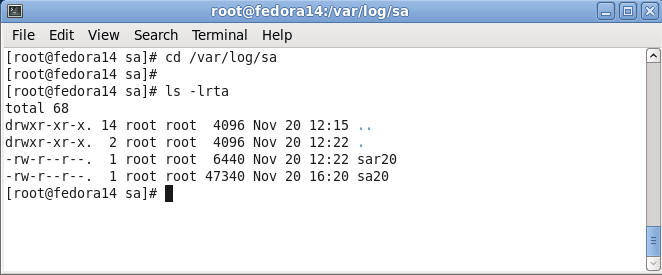
- SAR Log Directory
- Command:
- cd /var/log/sa
- ls -lrta
- Note:
- sar20
- The naming convention is "sar" + "day number" In my case, today is 11-20-2011.
- This is an ascii file that contain the daily activity for the particular date.
- sa20
- The naming convention is "sa" + "20".
- The file is an data file that contain the daily activity, except in binary format.
- sar20
- Command:
| Section 5. SAR Commands |
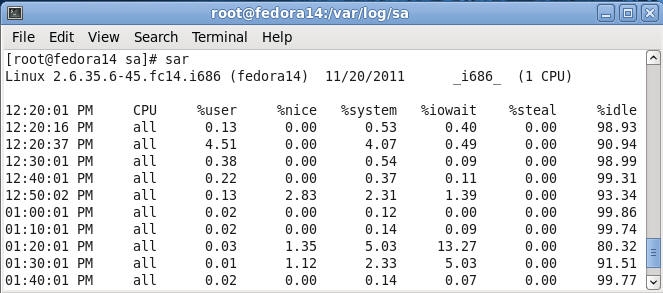
- Basic SAR command
- Command: sar
- Note:
- Notice that after the first three lines, each new line is added every 10 minutes.
- This command is looking at CPU for the
following:
- User
- Percentage of CPU utilization that occurred while executing at the user level (application).
- Nice
- Percentage of CPU utilization that occurred while executing at the user level with the nice priority
- System
- Percentage of CPU utilization that occurred while executing at the system level (kernel).
- IO Wait
- Percentage of time that the CPU or CPUs where idle during which the system had an outstanding disk I/O request.
- Steal
- Percentage of time spent in involuntary wait by the virtual CPU or CPUs while the hypervisor was servicing another virtual processor.
- Idle
- Percentage of time that the CPU or CPUs were ideal and the system did not have an outstanding disk I/O request.
- User
- Swap Usage
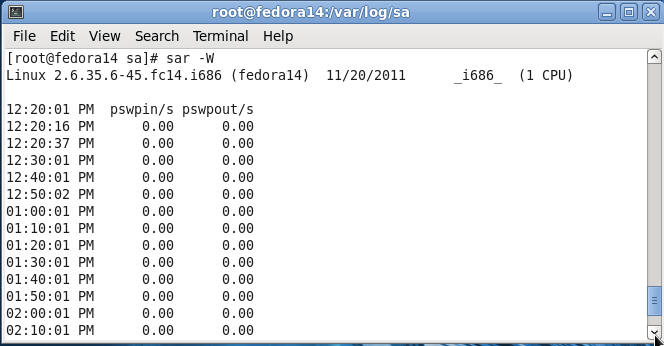
- Command: sar -W
- Notes:
- You can use this command to tell if you are running out of ram.
- Being swapped out is normal for the Linux kernel, which will swap from time to time.
- Constant swapping is bad, and generally means you need more Ram.
- System Load
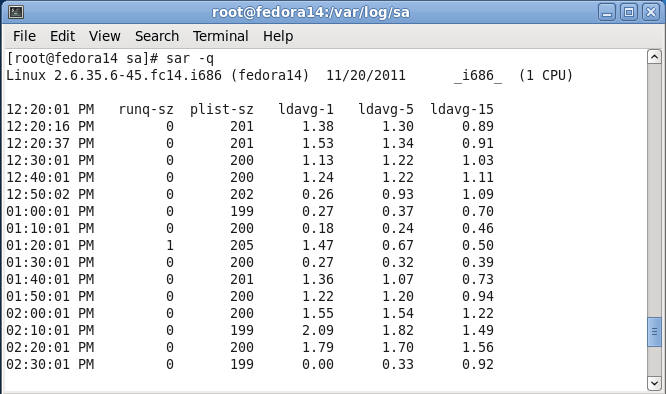
- Command: sar -q
- Notes:
sar -q
- Here we are checking to see if the processes are waiting too long to run on the CPU.
- Servers that are not doing much, should see something lower that 1.
- Report I/O and transfer rate statistics
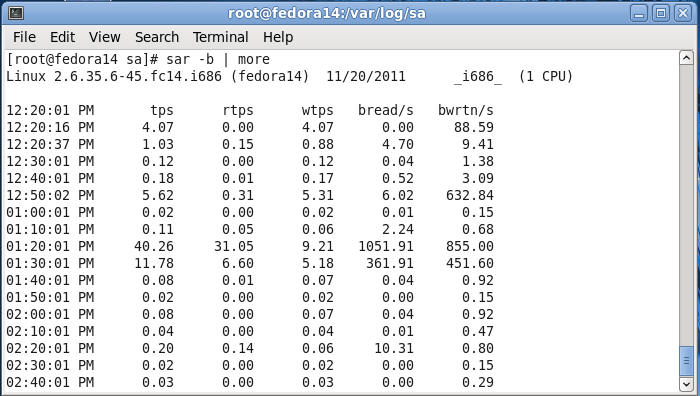
- Command: sar -b
- Notes:
- tps
- Total number of transfers per second that
were issued to physical devices. A transfer is an I/O
request to a physical device. Multiple logical requests can be combined into a single I/O request
to the device. A transfer is of indeterminate size.
- Total number of transfers per second that
were issued to physical devices. A transfer is an I/O
- rtps
- Total number of read requests per second issued to physical devices.
- wtps
- Total number of write requests per second issued to physical devices.
- bread/s
- Total amount of data read from the devices
in blocks per second. Blocks are equivalent to sectors
with 2.4 kernels and newer and therefore have a size of 512 bytes. With older kernels, a block is
of indeterminate size
- Total amount of data read from the devices
in blocks per second. Blocks are equivalent to sectors
- tps
- Real Time CPU Utilization
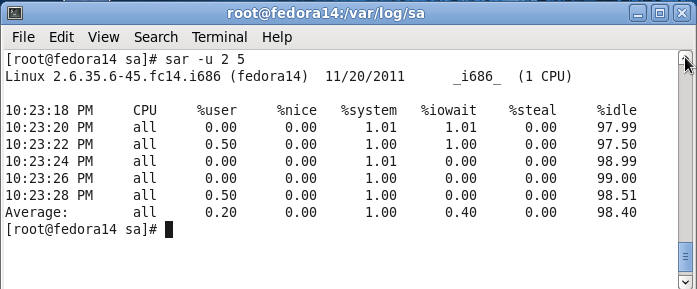
- Command: sar -u 2 5
- Notes: Report CPU utilization for each 2 seconds and display only 5 lines.
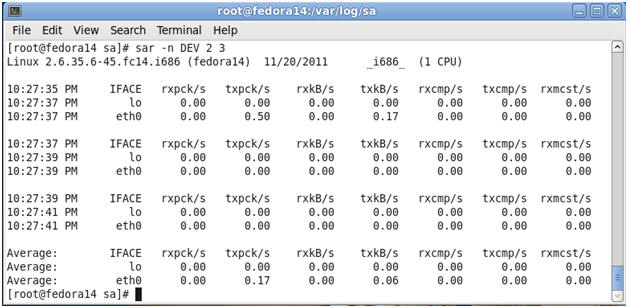
- Real Time Network Utilization
- Command: sar -n DEV 2 3
- Notes:
With the DEV keyword, statistics from the network devices are reported.
The following values are displayed:
- IFACE
- Name of the network interface for which statistics are reported.
- rxpck/s
- Total number of packets received per second.
- txpck/s
- Total number of packets transmitted per second.
- rxkB/s
- Total number of kilobytes received per second.
- txkB/s
- Total number of kilobytes transmitted per second.
- rxcmp/s
- Number of compressed packets received per second (for cslip etc.).
- txcmp/s
- Number of compressed packets transmitted per second.
- rxmcst/s
- Number of multicast packets received per second.
- IFACE
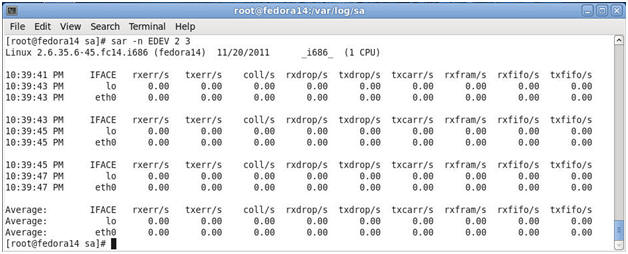
- Real Time Network Utilization
- Command: sar -n EDEV 2 3
- Notes:
With the EDEV keyword, statistics on failures (errors) from the network
devices are reported. The following values are displayed:
- IFACE
- Name of the network interface for which statistics are reported.
- rxerr/s
- Total number of bad packets received per second.
- txerr/s
- Total number of errors that happened per second while transmitting packets.
- coll/s
- Number of collisions that happened per second while transmitting packets.
- rxdrop/s
- Number of received packets dropped per second because of a lack of space in linux buffers.
- txdrop/s
- Number of transmitted packets dropped per second because of a lack of space in linux buffers.
- txcarr/s
- Number of carrier-errors that happened per second while transmitting packets.
- rxfram/s
- Number of frame alignment errors that happened per second on received packets.
- rxfifo/s
- Number of FIFO overrun errors that happened per second on received packets.
- txfifo/s
- Number of FIFO overrun errors that happened per second on transmitted packets.
- IFACE
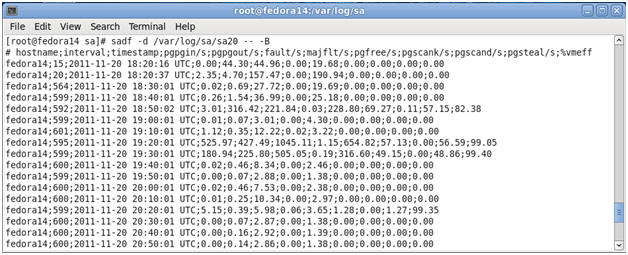
- Display data collected by sar in multiple
formats.
- Command:
sadf -d /var/log/sa/sa20 -- -B
- Remember, sa20 will be different in your case. It will be today's date.
- Notes:
- sadf -d extracts data in a format that can be easily ingested by a relational database.
- Both Excel and Open Office will allow us to specify a semicolon as a field delimiter. Then we can generate our performance report and graph.
-
Proof of Lab:
- Do a PrtScn, Paste into a word document, Upload to Moodle.
- Command:
sadf -d /var/log/sa/sa20 -- -B
| Section: Proof of Lab |
- Cut and Paste a screen shot of Section 5, Step 8 into a word document and upload to Moodle.