(Volatility: Lesson 2)
{ Analyzing Memory Capture for Windows XP SP2 }
| Section 0. Background Information |
- Volatility Overview
- https://www.volatilesystems.com/
- The Volatility Framework is a completely open collection of tools, implemented in Python under the GNU General Public License, for the extraction of digital artifacts from volatile memory (RAM) samples. The extraction techniques are performed completely independent of the system being investigated but offer unprecedented visibility into the runtime state of the system. The framework is intended to introduce people to the techniques and complexities associated with extracting digital artifacts from volatile memory samples and provide a platform for further work into this exciting area of research.
- Pre-requisite Labs
- Install Volatility Framework 2.0 on BackTrack5 Lab
- Dump Window's Physical Memory to BackTrack5 Using Helix and NetCat
- Legal Disclaimer
- As a condition of your use of this Web site, you warrant to computersecuritystudent.com that you will not use this Web site for any purpose that is unlawful or that is prohibited by these terms, conditions, and notices.
- In accordance with UCC § 2-316, this product is provided with "no warranties, either express or implied." The information contained is provided "as-is", with "no guarantee of merchantability."
- In addition, this is a teaching website that does not condone malicious behavior of any kind.
- You are on notice, that continuing and/or using this lab outside your "own" test environment is considered malicious and is against the law.
- © 2013 No content replication of any kind is allowed without express written permission.
| Section 1: Login to BackTrack |
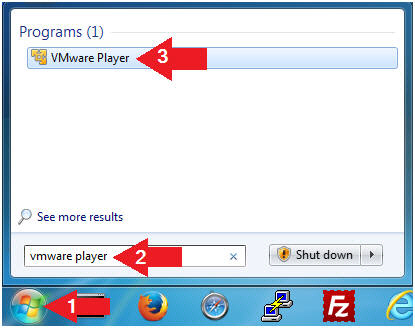
- Open VMware Player on your (Host
Windows Machine).
- Instructions:
- Click the Start Button
- Type "vmware player" in the search box
- Click on VMware Player
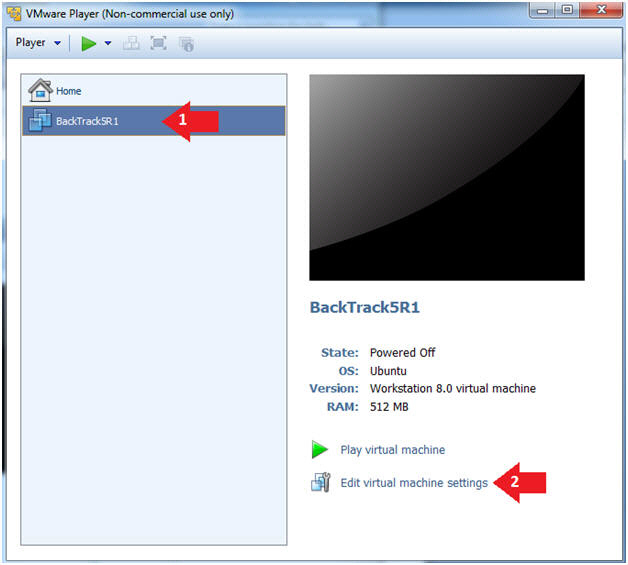
- Instructions:
- Edit the BackTrack5R1 VM
- Instructions:
- Select BackTrack5R1 VM
- Click Edit virtual machine settings
- Instructions:
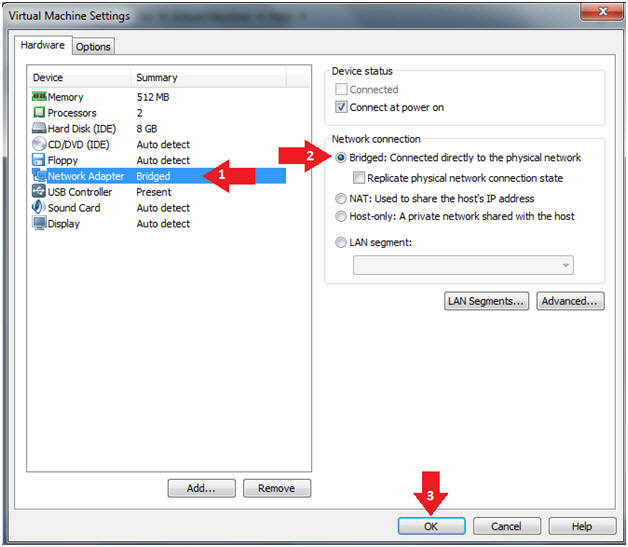
- Edit Virtual Machine Settings
- Instructions:
- Click on Network Adapter
- Click on the Bridged Radio button
- Click on the OK Button
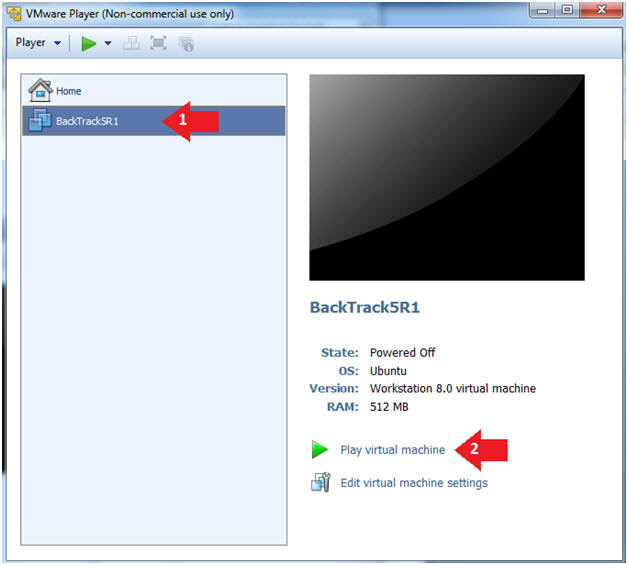
- Instructions:
- Play the BackTrack5R1 VM
- Instructions:
- Click on the BackTrack5R1 VM
- Click on Play virtual machine
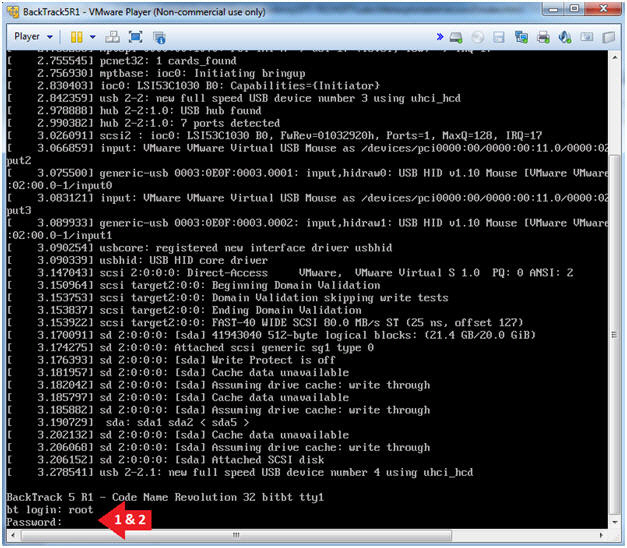
- Instructions:
- Login to BackTrack
- Instructions:
- Login: root
- Password: toor or <whatever you changed it to>.
- Instructions:
- Bring up the GNOME
- Instructions:
- Type startx
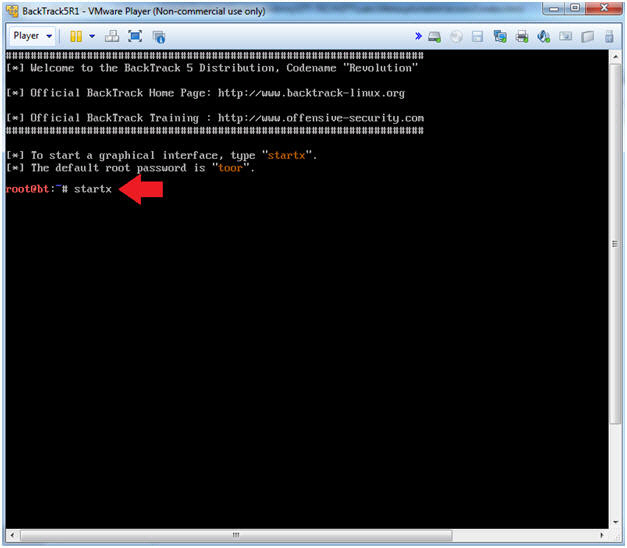
- Instructions:
| Section 2: Bring up a console terminal |
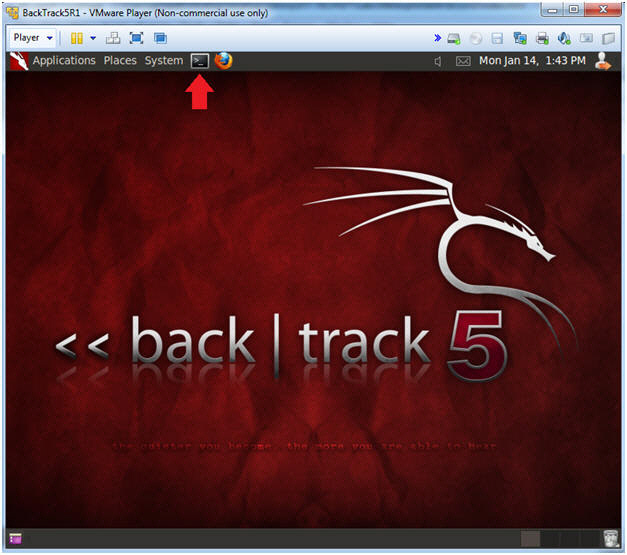
- Start up a terminal window
- Instructions:
- Click on the Terminal Window
- Instructions:
| Section 3: Using Volatility |
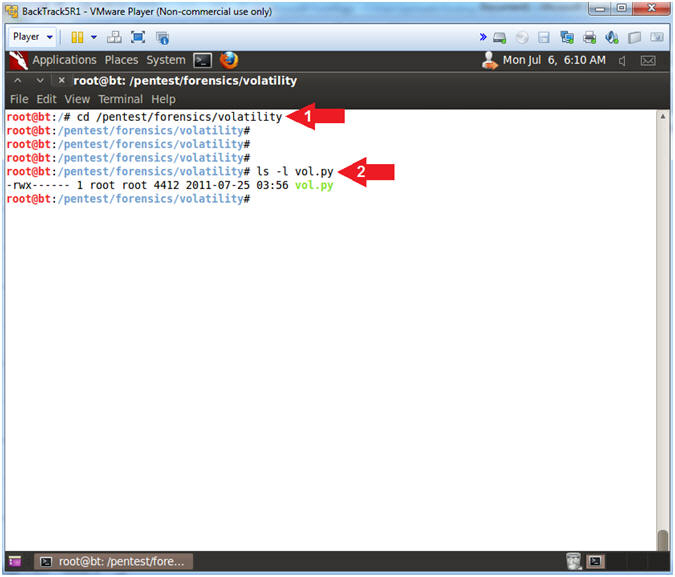
- Navigate to Volatility
- Instructions
- cd /pentest/forensics/volatility
- ls -l vol.py
- Instructions
- Obtain the image profile
- Instructions:
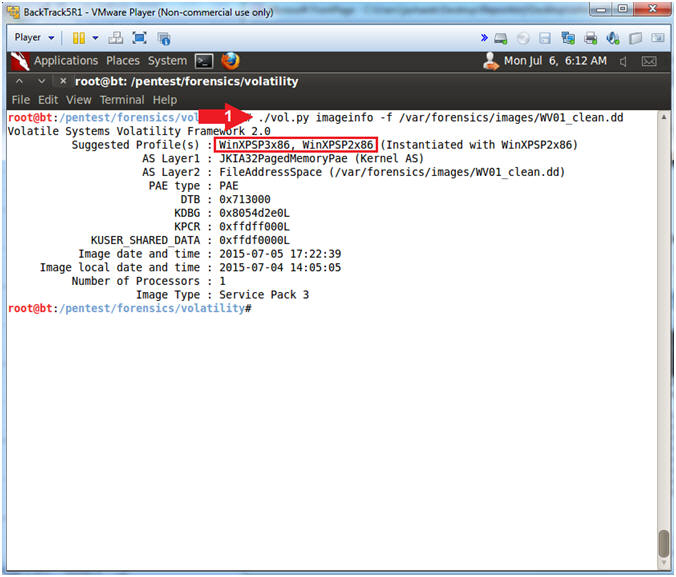
- ./vol.py imageinfo -f /var/forensics/images/WV01_clean.dd
- Notes(FYI):
- The Volatility Framework tries to guess and tell you what image profile to use.
- We know that our Server is Windows XP running SP2.
- Volatility suggest that we either use the profile WinXPSP3x86 or WinXPSP2x86.
- Also, we are running SP2 we will use the WinXPSP3x86 which seems to have more complete profile than WinXPSP2x86.
- View Running Processes
- Instructions
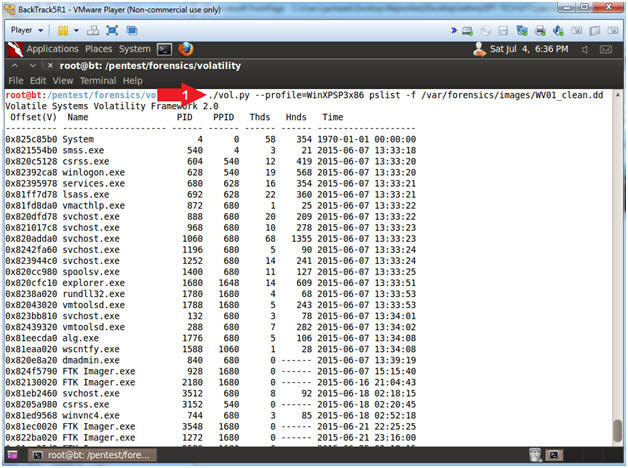
- ./vol.py --profile=WinXPSP3x86 pslist -f /var/forensics/images/WV01_clean.dd
- Notes(FYI):
- This displays all the running process during the time we captured the image in Helix Lesson 4.
- Searching for Specific Processes
- Instructions:
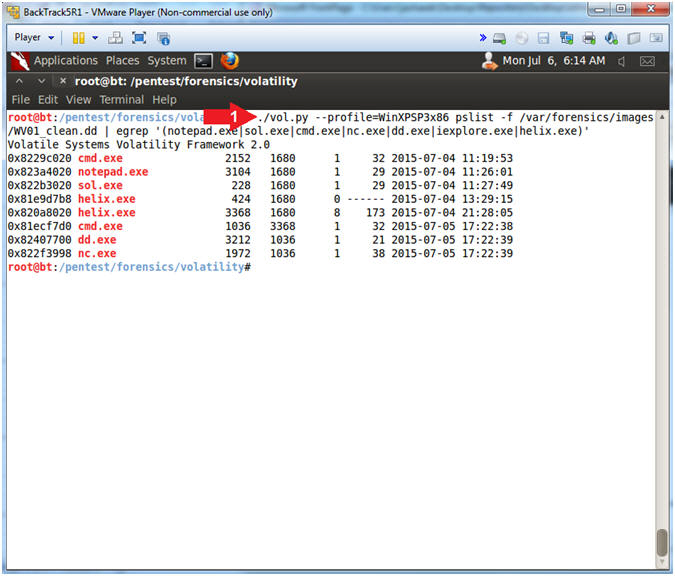
- ./vol.py --profile=WinXPSP3x86 pslist -f /var/forensics/images/WV01_clean.dd | egrep '(notepad.exe|sol.exe|cmd.exe|nc.exe|dd.exe|iexplore.exe|helix.exe)'
- Notes(FYI):
- egrep - Is like grep, but it lets you search for multiple strings.
- notepad.exe - Is the Notepad application.
- sol.exe - Is Solataire.
- cmd.exe - Is the Command Prompt that we started.
- nc.exe - Is NetCat which was started by Helix.
- dd.exe - Was started by Helix. It made the memory image.
- iexplore.exe - Internet Explorer.
- helix.exe - Helix
- Instructions:
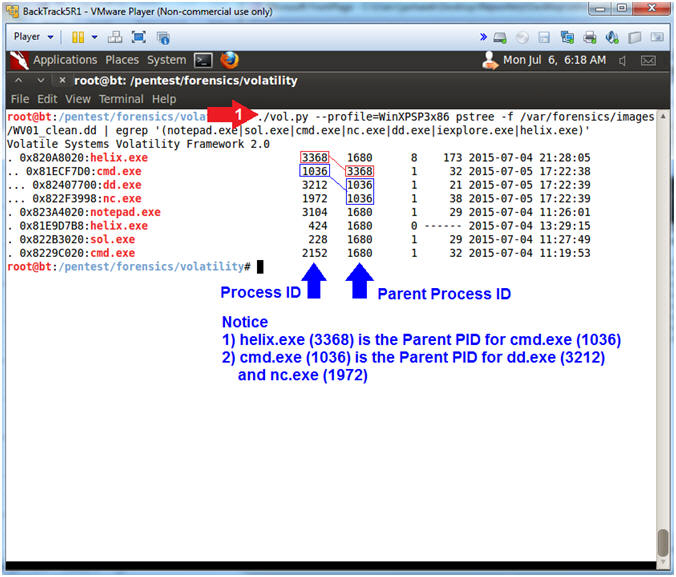
- Associating Parent and Child Processes
- Instructions:
- ./vol.py --profile=WinXPSP3x86 pstree -f /var/forensics/images/WV01_clean.dd | egrep '(notepad.exe|sol.exe|cmd.exe|nc.exe|dd.exe|iexplore.exe|helix.exe)'
- Notes(FYI):
- pstree - Print process list as a tree
- Notice the two columns of numbers after executable. The far left column is the Process ID (PID) for the executable. The far right column is the Parent Process ID (PPID) for the executable.
- Notice that Helix's PID is 3368 and it is the PPID for the cmd.exe PID(1036). Also, cmd.exe's PID(1036) is PPID for dd.exe(3212) and nc.exe(1972). Thus, the Helix is the PPID for not only cmd.exe, but also, dd.exe and nc.exe.
- These PIDs will be different in your case!!!
- Instructions:
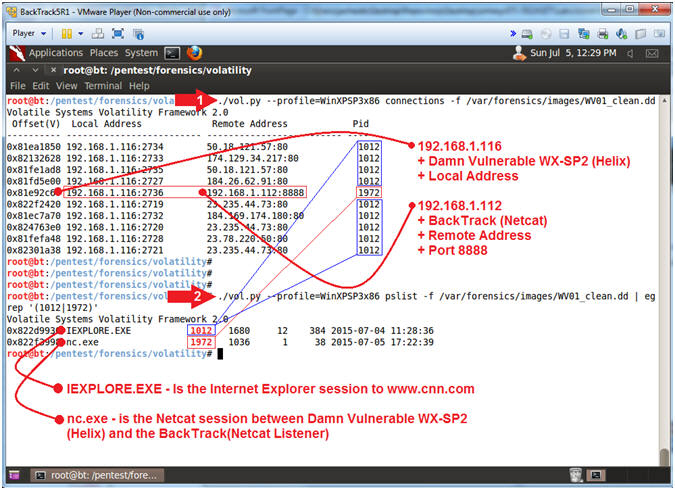
- View Network Connections and Tie to Running
Processes
- Instructions:
- ./vol.py --profile=WinXPSP3x86
connections -f /var/forensics/images/WV01_clean.dd
- This command lets you view all open Network Connections.
- ./vol.py --profile=WinXPSP3x86
pslist -f /var/forensics/images/WV01_clean.dd
| egrep '(1012|1972)'
- This command lets you search the process list for all the network connections.
- Note(FYI):
- These numbers will be different in your case!!!
- ":80" shows the web processes.
- ":8888" shows the NetCat process.
- Replace 1012|1972 with your process IDs (Pid), and separate each Pid with a pipe(|).
- View and Interrogate Network Connections
- Instructions
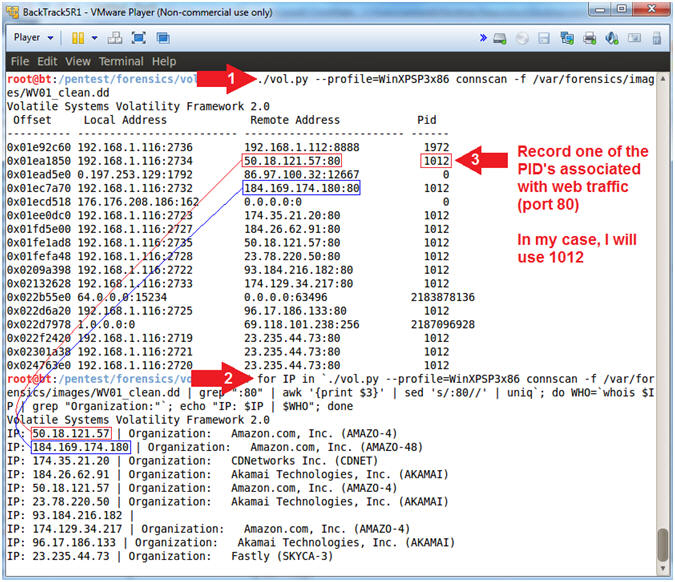
- ./vol.py --profile=WinXPSP3x86 connscan -f /var/forensics/images/WV01_clean.dd
- for IP in `./vol.py --profile=WinXPSP3x86 connscan -f /var/forensics/images/WV01_clean.dd | grep ":80" | awk '{print $3}' | sed 's/:80//' | uniq`; do WHO=`whois $IP | grep "Organization:"`; echo "IP: $IP | $WHO"; done
- Record one of the Process IDs (PID) associated with web traffic on port 80
- Note(FYI):
- ./vol.py --profile=WinXPSP3x86 connscan -f /var/forensics/images/WV01_clean.dd, this command looks at all TCP connection both open and terminated.
- for, do, and done, is the skeleton of a for loop in Bourne (sh) shell.
- grep ":80", filter or display only port 80 connections of the vol.py results.
- awk '{print $3}', cut out the third column of the vol.py results.
- sed 's/:80//', remove the string ":80" from each IP Address.
- uniq, remove any duplicate IP Addresses.
- WHO=`whois $IP | grep "Organization:"`,do a whois lookup on each IP address and assign the results to the WHO variable.
- echo "IP: $IP | $WHO", print out the IP address and organization to the screen.
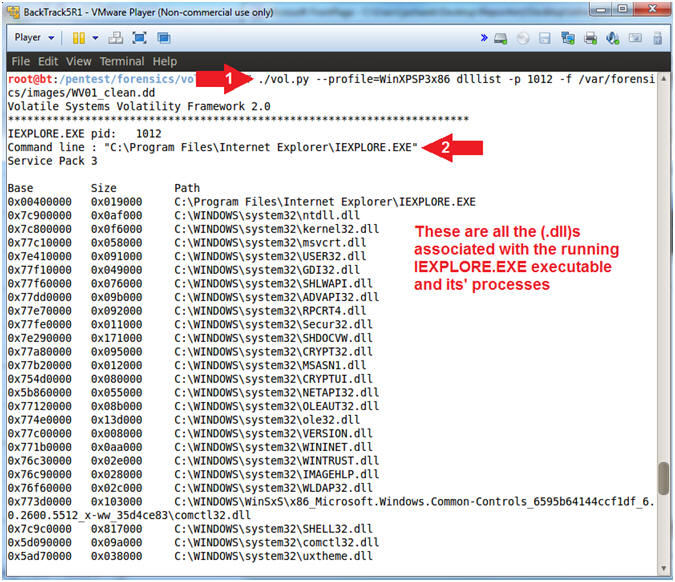
- View DLL used by a Running Processes
- Instructions:
- ./vol.py --profile=WinXPSP3x86 dlllist -p 1012 -f /var/forensics/images/WV01_clean.dd
- Note(FYI):
- PID 1012 is my process ID associated with Internet Explorer. Supply the PID you recorded in the previous step above.
- The purpose of this tool is to list all the dll's that are associated to the particular process ID, which happens to be Internet Explorer.
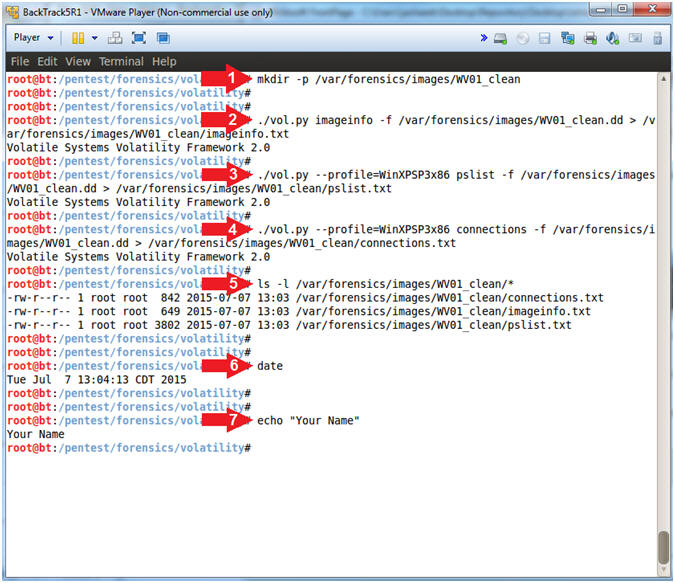
| Section 5: Proof of Lab |
- Proof of Lab
- Instructions:
- mkdir -p /var/forensics/images/WV01_clean
- ./vol.py imageinfo -f /var/forensics/images/WV01_clean.dd > /var/forensics/images/WV01_clean/imageinfo.txt
- ./vol.py --profile=WinXPSP3x86 pslist -f /var/forensics/images/WV01_clean.dd > /var/forensics/images/WV01_clean/pslist.txt
- ./vol.py --profile=WinXPSP3x86 connections -f /var/forensics/images/WV01_clean.dd > /var/forensics/images/WV01_clean/connections.txt
- ls -l /var/forensics/images/WV01_clean/*
- date
- echo "Your Name"
- Note:
- Replace the string "Your Name" with your actual name.
- E.g., echo "John Gray"
- Note:
-
Proof Of Lab Instructions:
- Press the <Ctrl> and <Alt> key at the same time.
- Press the <PrtScn> key.
- Paste into a word document
- Upload to Moodle
- Instructions: