(LosBuntu: BadBlue Memory Analysis)
{ Tracking Meterpreter Footprints with Volatility and Perl }
| Section 0: Background Information |
- What is the scenario?
- The following lesson shows you how to take memory analysis one step further, by identifying if a Meterpreter session is attached to an exploited process and/or remote connection. Meterpreter sessions are difficult to track, because they use DLL injections by inserting code into a running process. We are manually going to walk through various Volatility Plug-ins and dissect the ramifications of DLLs used; Child Processes spawned; Privileges Gain; Security Identifiers acquired and inherited; and Malware positively identified. Then, we will visually connect the dots using a Perl script to automate the Meterpreter Volatility Analysis to generate a report.
- What is DLL Injection?
- DLL injection is a technique used for running code within the address space of another process by forcing it to load a dynamic-link library. DLL injection is often used by external programs to illicit and influence an adverse behavior outside of the scope of the programs (eg., Webserver, FTP, VNC, Flash) original intent.
- Hunting for Reflective DLL Injection Libraries
(IPHLPAPI.DLL and rsaenh.dll)?
- In Metasploit v3.3 and later, a Reflective DLL injection uses both IPHLPAPI.DLL and rsaenh.dll. (IPHLPAPI.DLL) is a Dynamic Link Library containing the functions used by the Windows IP Helper API. (rsaenh.dll) is a module that implements the Microsoft enhanced cryptographic service provider (CSP) that uses 128-bit encryption.
- What is an Ephemeral Port?
- An ephemeral port is a short-lived transport protocol port for Internet Protocol (IP) communications allocated automatically from a predefined range by the IP software. It is used by the Transmission Control Protocol (TCP), User Datagram Protocol (UDP), or the Stream Control Transmission Protocol (SCTP) as the port assignment for the client end of a client–server communication to a well known port on a server.
- Special Thanks!!!
- I wanted to thank my good friend Carlos Cajigas (@carlos_cajigas) for creating LosBuntu and for his generous guidance and mentorship in Cyber Forensics.
- I wanted to thank Tim Medin (@timmedin) for his article (Finding Meterpreter)
- I wanted to thank my Cyber Heroes: Michael Hale Ligh(@iMHLv2), Andrew Case (@attrc), and Stephen Fewer(@stephenfewer).
- References
- Author: @PROFESX0R
- The Art of Memory Forensics; Michael Hale Ligh(@iMHLv2), Andrew Case (@attrc), Jamie Levy(@gleeda) and Aaron Walters;
- Malware Analyst's Cookbook; Michael Hale Ligh(@iMHLv2), Steven Adair(@stevenadair), Blake Hartstein and Matthew Richard;
- ReflectiveDLLInjection; Stephen Fewer(@stephenfewer);
- Windows DLL Injection Basics, Brad Antoniewicz
- Finding Meterpreter, Tim Medin (@timmedin)
- Perl Script to Look for Meterpreter with Volatility Output, Sketchymoose
- Privilege Constants, Microsoft
- Pre-Requisite Lab
-
Lab Notes
- In this lab we will do the following:
- Determine Volatility profile using imageinfo
- Use Volatility dlllist to search for IPHLPAPI.DLL and rsaenh.dll.
- Use Volatility pstree to recursively discover related processes.
- Use Volatility netscan to interrogate network connections.
- Use Volatility privs to view privileges associated with potentially malicious processes.
- Use Volatility getsids to view security identifiers associated with potentially malicious processes.
- Use Volatility malfind to view VAD Protections and Executable Signatures.
- Use Volatlity procdump to extract process executable from captured image.
- Use VirusTotal to scan procdump extract for a malicious signature.
- Then automate entire process with Perl
- In this lab we will do the following:
- Legal Disclaimer
- As a condition of your use of this Web site, you warrant to computersecuritystudent.com that you will not use this Web site for any purpose that is unlawful or that is prohibited by these terms, conditions, and notices.
- In accordance with UCC § 2-316, this product is provided with "no warranties, either express or implied." The information contained is provided "as-is", with "no guarantee of merchantability."
- In addition, this is a teaching website that does not condone malicious behavior of any kind.
- You are on notice, that continuing and/or using this lab outside your "own" test environment is considered malicious and is against the law.
- © 2016 No content replication of any kind is allowed without express written permission.
| Section 1: Power On the LosBuntu VM |
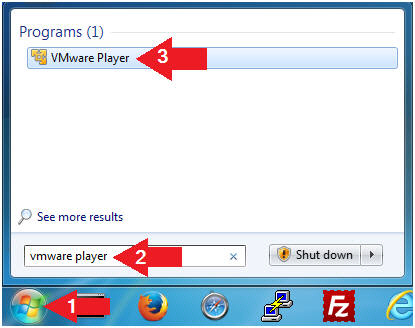
- Open VMware Player on your windows machine.
- Instructions:
- Click the Start Button
- Type "vmware player" in the search box
- Click on VMware Player
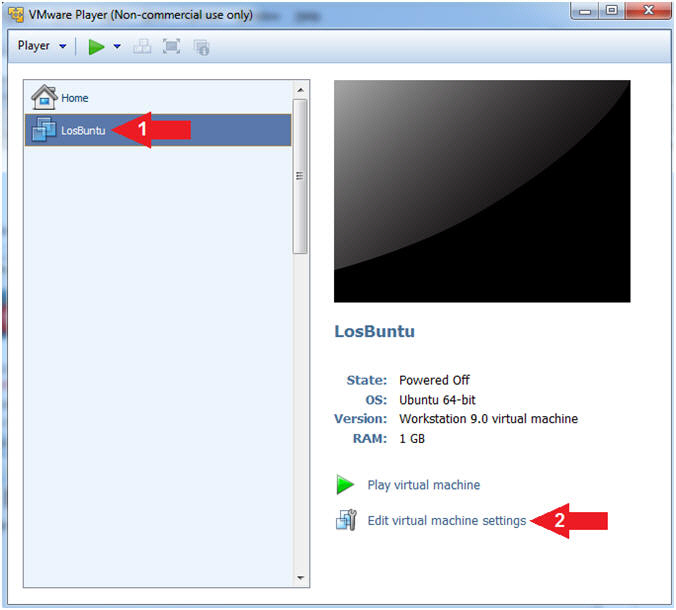
- Instructions:
- Edit Virtual Machine Settings
- Instructions:
- Select LosBuntu
- Click Edit Virtual Machine Settings
- Instructions:
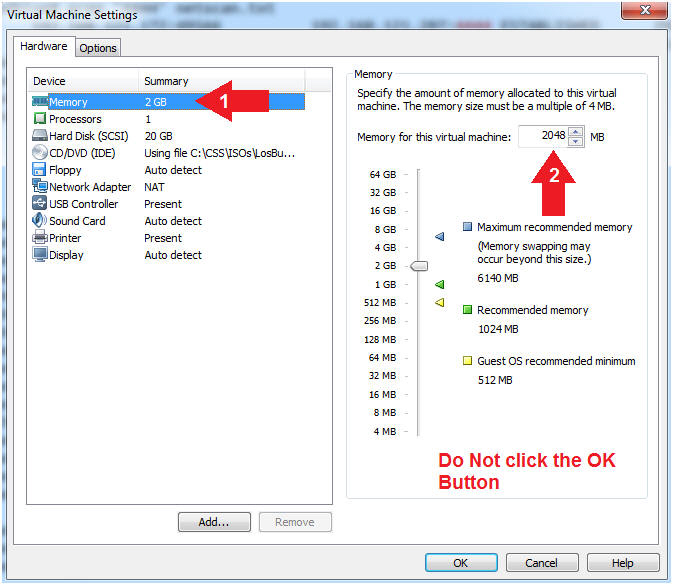
- Configure Memory
- Instructions:
- Click on Memory.
- Up the memory to 2 GB
- Note(FYI):
- LosBuntu will need 1.5 to 2 GB for this memory analysis.
- Do NOT Click the OK Button, we still have more to configure.
- Instructions:
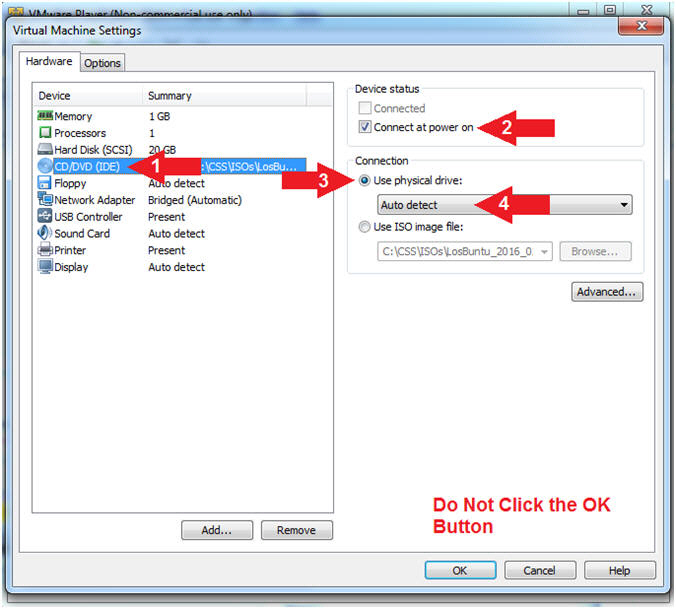
- Configure CD/DVD(IDE)
- Instructions:
- Click on CD/DVD(IDE)
- Device status: Check Connect at power on
- Connection: Click Use physical drive
- Select Auto detect
- Note(FYI):
- Do NOT Click the OK Button, we still have more to configure
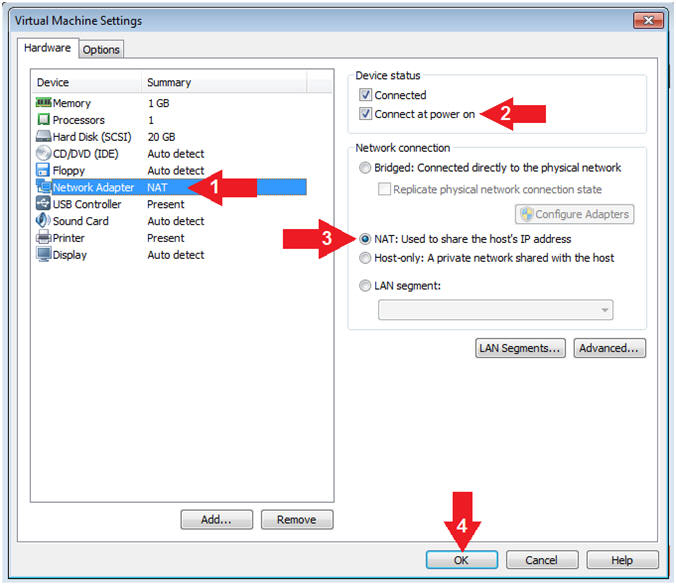
- Instructions:
- Configure Network Adapter
- Instructions:
- Click on Network Adapter
- Device status: Check Connect at power on
- Network Connection: Click NAT: Used to share the ....
- Click the OK Button
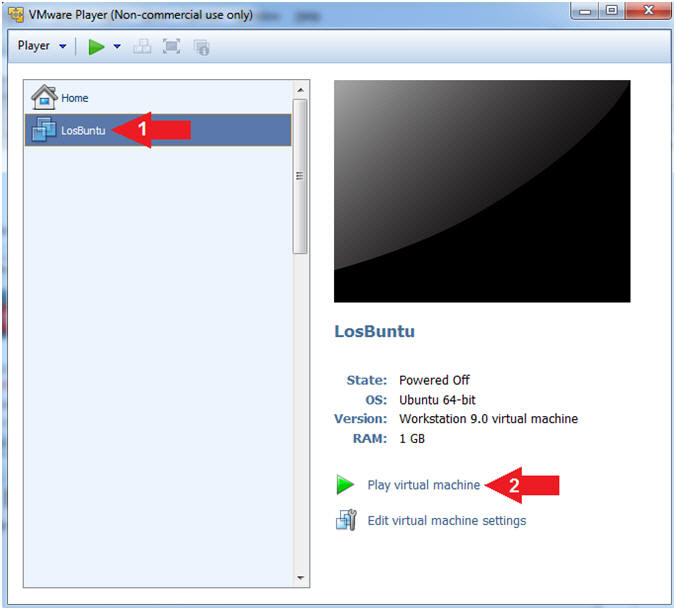
- Instructions:
- Play LosBuntu Virtual Machine
- Instructions:
- Select LosBuntu
- Click Play virtual machine
- Instructions:
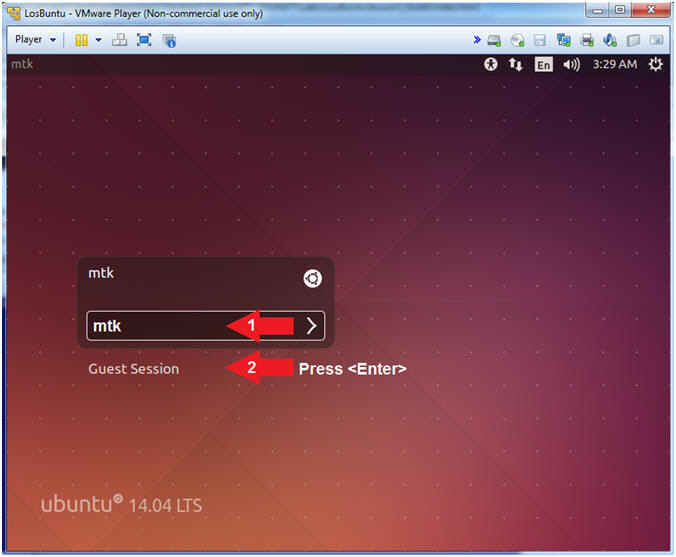
| Section 2: Login to LosBuntu |
- Login to LosBuntu
- Instructions:
- Password: mtk
- Press <Enter>
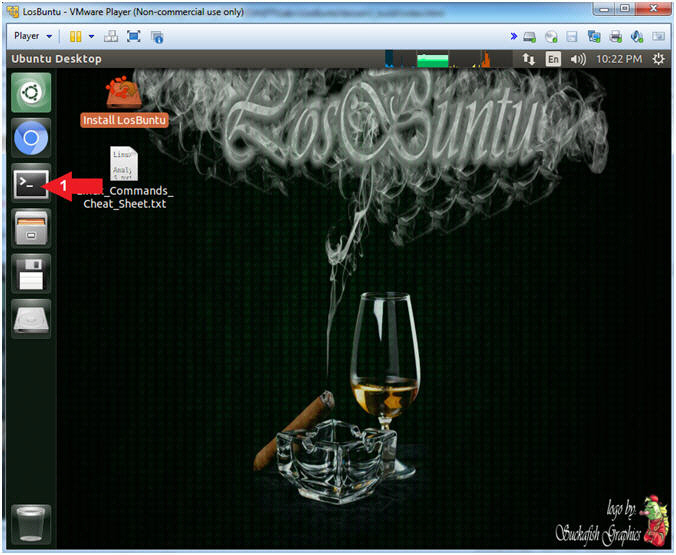
- Instructions:
- Open Terminal Windows
- Instructions:
- Click on the Terminal Window

- Click on the Terminal Window
- Instructions:
- Become root
- Instructions:
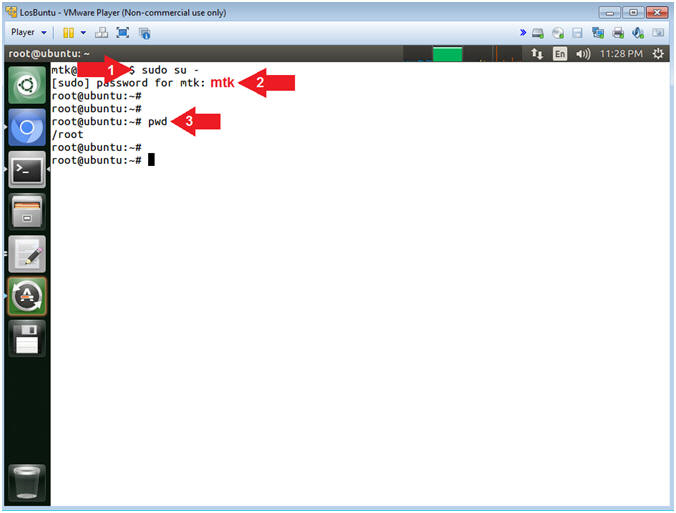
- sudo su -
- password: mtk
- pwd
- Note(FYI):
- Command #1, Use (sudo su -) to simulate an initial root login where the /etc/profile, .profile and .bashrc are executed. Not only will the root user's environment be present, but also the root user will be placed in it's own home directory (/root).
- Command #2, Use (pwd) to display the current working directory of the particular user.
- Instructions:
- Obtain IP Address
- Instructions:
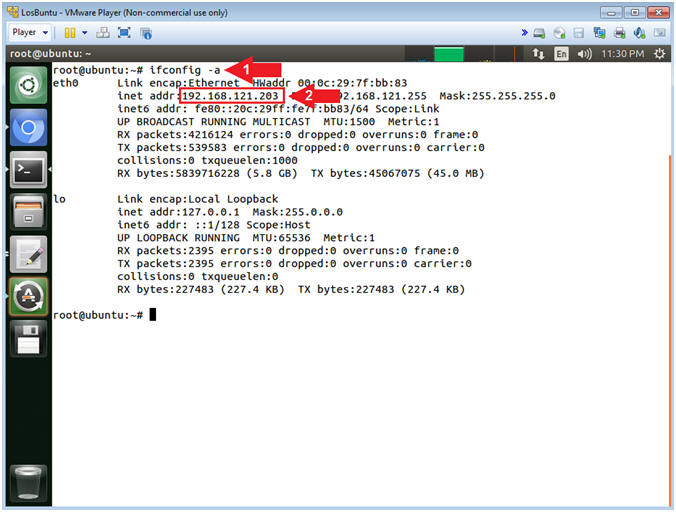
- ifconfig -a
- Record Your IP Address
- Note(FYI):
- Command #1, Use (ifconfig) to view all
(-a) IP Addresses associated with LosBuntu. You should only have
two interfaces: eth0 and lo.
- eth0 - Is the primary interface. In my case, the IP Address is 192.168.121.203.
- lo - Is the local loopback address. The loopback address is used to establish an IP connection to the same machine orbr.bbring used by the end-user. The loopback construct gives a computer or device capable of networking the capability to validate or establish the IP stack on the machine.
- If your host machine has Internet
Connectivity, but LosBuntu does not have an IP Address associated
with eth0, then issue the following command as root.
- dhclient -v
- Command #1, Use (ifconfig) to view all
(-a) IP Addresses associated with LosBuntu. You should only have
two interfaces: eth0 and lo.
- Instructions:
| Section 3: Make Image Backups |
- Make Image Backup Copies
- Instructions
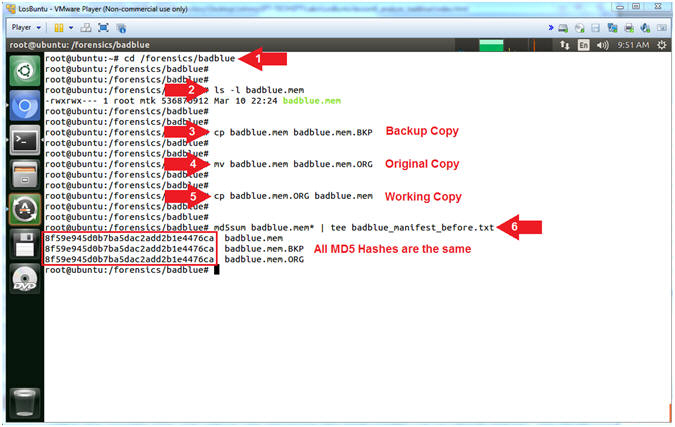
- cd /forensics/badblue
- ls -l badblue.mem
- cp badblue.mem badblue.mem.BKP
- mv badblue.mem badblue.mem.ORG
-
cp badblue.mem.ORG badblue.mem - md5sum badblue.mem* | tee badblue_manifest_before.txt
- Instructions
- Command #1, Use (cd) to change directory into (/forensics/badblue).
- Command #2, Use (ls -l) to view the file (badblue.mem) details. E.g., Permissions(-rwxr--r--), Ownerships(root root), Byte Size, etc.
- Command #3, Use (cp) to make a backup copy file (badblue.mem.BKP) of the original memory dump.
- Command #4, Use (mv) to rename the original memory file to (badblue.mem.ORG).
- Command #5, Use (cp) to make a working copy (badblue.mem) of the original file (badblue.mem.ORG).
- Command #6, Use (md5sum) to make a md5 hash of each badblue.mem file. Use a wildcard(*) with badblue.mem* to list all the badblue.mem files. Use (tee) to display both the output to the screen and write that output to a file (badblue_manifest_before.txt)
- Instructions
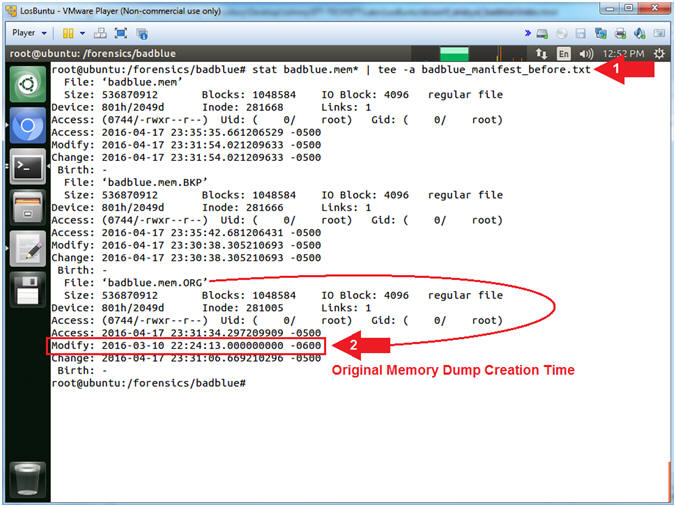
- stat badblue.mem* | tee -a badblue_manifest_before.txt
- Notice the modify time of badblue.mem.ORG.
- Note(FYI):
- Command #1, Use (stat) to display the following attributes: Size, Permission Access (0744), User ID (root), Group ID (root), Access Time, Modify Time, and Change Time. Use (tee -a) to display and append(-a) the standard output to the already created file(badblue_manifest_before.txt).
- Command #2, Notice that (badblue.mem.ORG) has the oldest modify time, because it is indeed the original memory file. Going forward, if you need to make a new copy, you can use the (badblue.mem.BKP). We should preserve the (badblue.mem.ORG) by not accessing it, unless your have corrupted all of your other copies.
| Section 4: Download Perl Volatility Meterpreter Analysis Scripts |
- Download Perl Volatility Meterpreter Analysis
Scripts
- Instructions
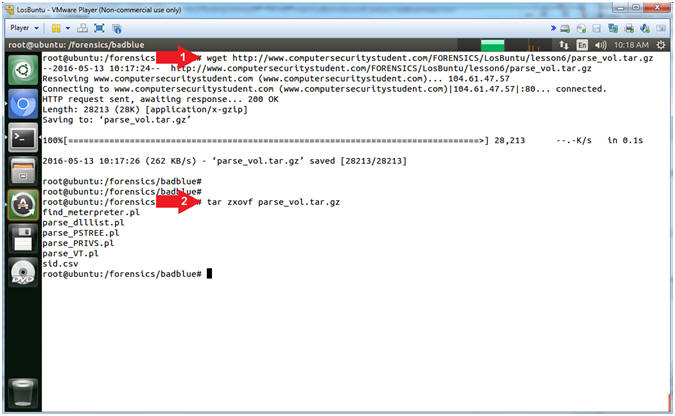
- wget http://www.computersecuritystudent.com/FORENSICS/LosBuntu/lesson6/parse_vol.tar.gz
- tar zxovf parse_vol.tar.gz
- Note(FYI):
- Command #1, Use (wget) to download the perl scripts (parse_vol.tar.gz).
- Command #2, Use (tar) to unzip(z), to extract(x), to not preserve ownership(o), in verbose mode(v), to specify file(f) for the tar file (parse_vol.tar.gz).
- Instructions
- Set Ownerships and Permissions
- Instructions
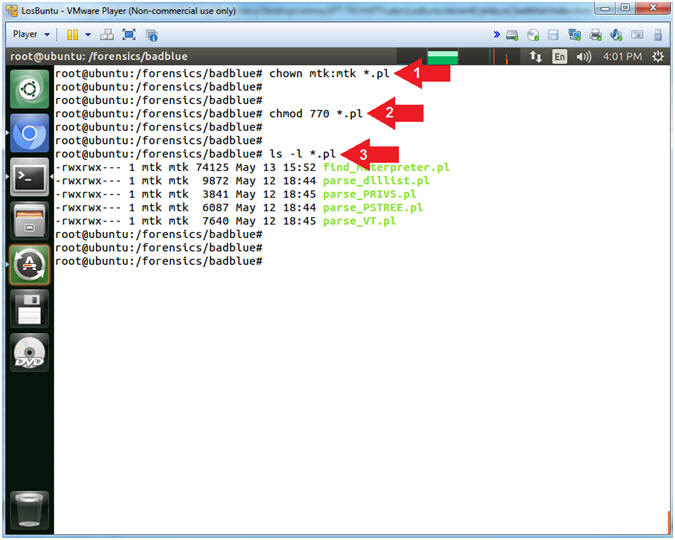
- chown mtk:mtk *.pl
- chmod 770 *.pl
- ls -l *.pl
- Note(FYI):
- Command #1, Use (chown)
to change the ownership of both the user(mtk) and group(mtk) for all
files that end with (*.pl).
- E.g., chown user:group file
- Command #2, Use (chmod) to change the permissions to where both the user(mtk) and group(mtk) have (read[4],write[2],execute[1]) permissions. Where read[4] + write[2] + execute[1] = 7.
- Command #3, Use (ls -l) to list all the files that end with (*.pl), where (*) is a wildcard.
- Command #1, Use (chown)
to change the ownership of both the user(mtk) and group(mtk) for all
files that end with (*.pl).
- Instructions
| Section 5: Determine Volatility Profile (imageinfo) |
- Determine Which Profile to Use
- Instructions
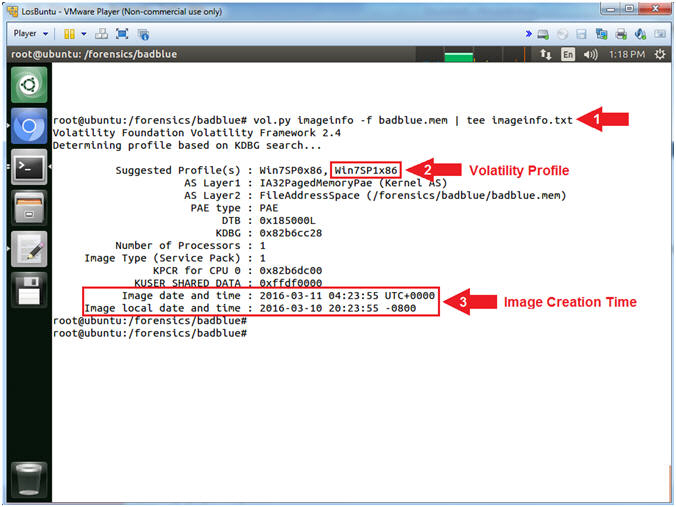
- vol.py imageinfo -f badblue.mem | tee imageinfo.txt
- Record the right most suggested Volatility Profile.
- View the Image Date and Time.
- Note(FYI):
- Command #1, Use (imageinfo) to ask Volatility to identify the Operating System Version of the image (badblue.mem).
- Command #2, Typically you will use the right most suggested Volatility Profile that is not in parenthesis.
- Command #3, If this was an image from a crash dump, then the highlighted time would reflect the crash dump time. Accordingly, this is the time the image was created.
- Instructions
| Section 6: Display Dynamic Link Libraries with Volatility (dlllist) |
- Display Dynamic Link Libraries
- Instructions
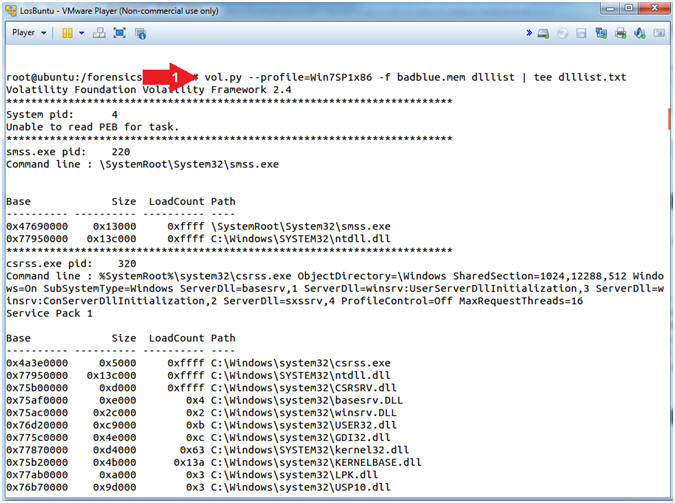
- vol.py --profile=Win7SP1x86 -f badblue.mem dlllist | tee dlllist.txt
- Note(FYI):
- Command #1, Use (dlllist) to display the DLLs loaded for each process. Use (tee) to display and write standard output into a file called (dlllist.txt).
- Instructions
- Searching for Libraries
- Instructions
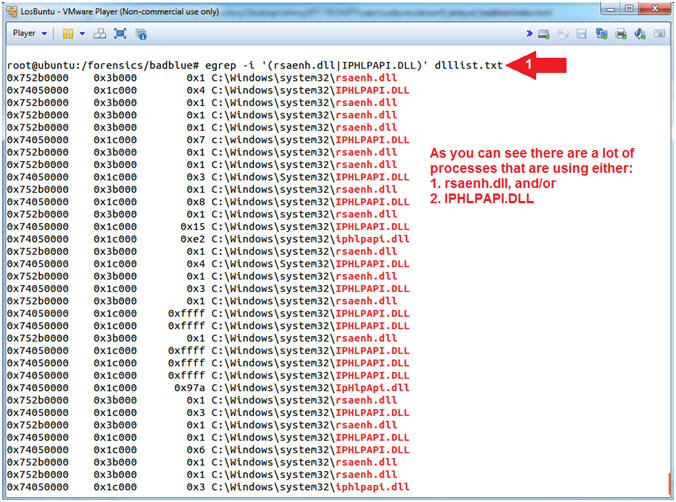
- egrep -i '(rsaenh.dll|IPHLPAPI.DLL)' dlllist.txt
- Note(FYI):
- Command #1, While ignoring case (-i), use (egrep) to search the file (dlllist.txt) for either (rsaenh.dll) or (IPHLPAPI.DLL).
- In Metasploit v3.3 and later, a Reflective DLL injection uses both IPHLPAPI.DLL and rsaenh.dll.
- (IPHLPAPI.DLL) is a Dynamic Link Library containing the functions used by the Windows IP Helper API.
- (rsaenh.dll) is a module that implements the Microsoft enhanced cryptographic service provider (CSP) that uses 128-bit encryption. (See Details and References)
- Obviously, there are a lot of processes that require network and encryption libraries.
- Instructions
- Viewing Dynamic Link Library Output
- Instructions
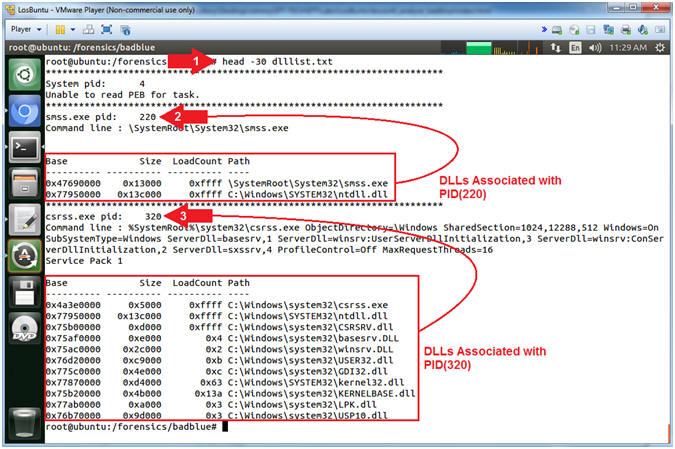
- head -30 dlllist.txt
- View the first group of DLLs
- View the second group of DLLs
- Note(FYI):
- Command #1, Use (head -30) to display the first 30 lines of output contained in the dlllist.txt file.
- Instruction #2, In my case PID (220) belongs to process (smss.exe) which is using the ntdll.dll.
- Instruction #3, In my case PID (320) belongs to process (csrss.exe) which is using MANY DLLs.
- Wouldn't it be nice to be able to not only associate and format each DLL with it's Process ID, but also to display only those Process IDs using specific DLLs? (See Next Step).
- Instructions
- Parsing Dynamic Link Libraries with Perl
- Instructions
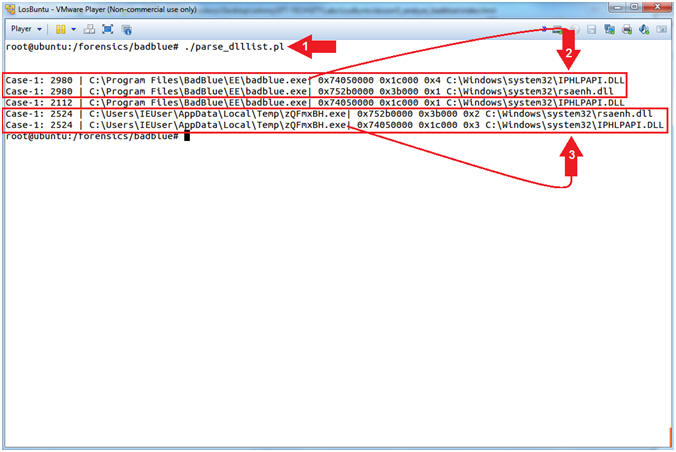
- ./parse_dlllist.pl
- Note(FYI):
- Command #1, Use (parse_dlllist.pl) to search the dlllist.txt for the following two DLLs: IPHLPAPI.DLL and rsaenh.dll. The output will be displayed in the following format: PID, Process/Executable, DLL Entry.
- In my case PID (2908) is associated with
the (badblue.exe) webserver that was exploited in a
previous lesson.
- Record your badblue.exe Process ID!
- In my case, PID (2525) is an oddly named
executable (zQFmxBH.exe) running out of the
Temp directory (C:\Users\*\Appdata\Local\Temp\).
- Record your zQFmxBH.exe Process ID!
- (parse_dlllist.pl) will
only display
programs that are using either IPHLPAPI.DLL -OR- rsaenh.dll, which
are not contained in the following white list.
- White Listed Programs: C:\Windows\system32\lsass.exe, C:\Windows\system32\lsm.exe, C:\Windows\system32\svchost.exe, C:\Windows\system32\dllhost.exe, C:\Windows\system32\taskhost.exe, C:\Windows\system32\vmicsvc.exe, C:\Windows\Explorer.EXE, C:\Windows\iExplorer.EXE, C:\Windows\system32\winlogon.exe, C:\Windows\system32\SearchIndexer.exe
- Instructions
| Section 7: Display the Process Tree with Volatility (pstree) |
- Display the Process Tree with PSTREE
- Instructions:
- vol.py --profile=Win7SP1x86 pstree -f badblue.mem | tee pstree.txt
- Note(FYI):
- Command #1, Use (pstree) to view the process listing in tree form. This enumerates processes using the same technique as (pslist). Note, it will not show hidden or unlinked processes. Child process are indicated using indention and periods. Use (tee) to display and write standard output to the file (pstree.txt).

- Instructions:
- Search PSTREE with EGREP
- Note(FYI):
- Replace the Process ID (2524) related to the oddly named executable (zQFmxBH.exe) with your PID found in [Section 6, Step 4].
- Replace the Process ID (2980) related to the badblue.exe executable with your PID found in [Section 6, Step 4].
- Instructions:
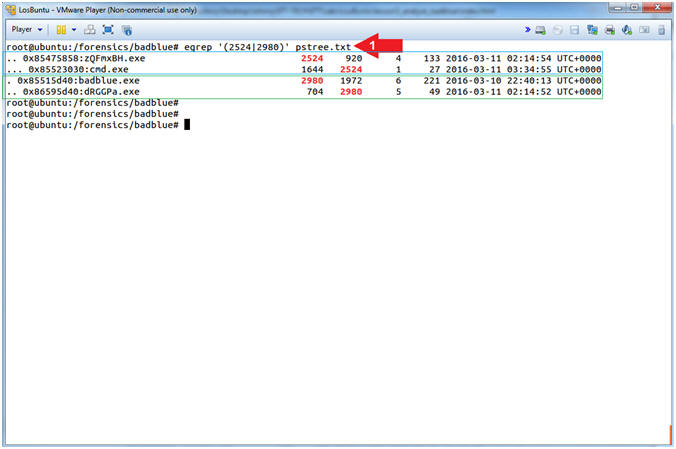
- egrep '(2524|2980)' pstree.txt
- Note(FYI):
- Command #1, Use (egrep) to search the file (pstree.exe) for the PID (2524) or (2980).
- zQFmxBH.exe (2524) is the stager associated with (exploit/windows/local/bypassuac). Remember this module is used to bypass the Windows User Account Control (UAC). Notice it spawned a command prompt.
- badblue.exe (2980) spawned another oddly named executable (dRGGPa.exe), which is the stager associated with the badblue exploit (exploit/windows/http/badblue_passthru).
- Wouldn't it be nice to be able to see all the Parent and Child Processes associated with (badblue.exe[2980]) and (zQFmxBH.exe[2524])?
- Note(FYI):
- Parsing PSTREE Output with Perl
- Note(FYI):
- Replace the Process ID (2524) related to the oddly named executable (zQFmxBH.exe) with your PID found in [Section 6, Step 4].
- Replace the Process ID (2980) related to the badblue.exe executable with your PID found in [Section 6, Step 4].
- Instructions:
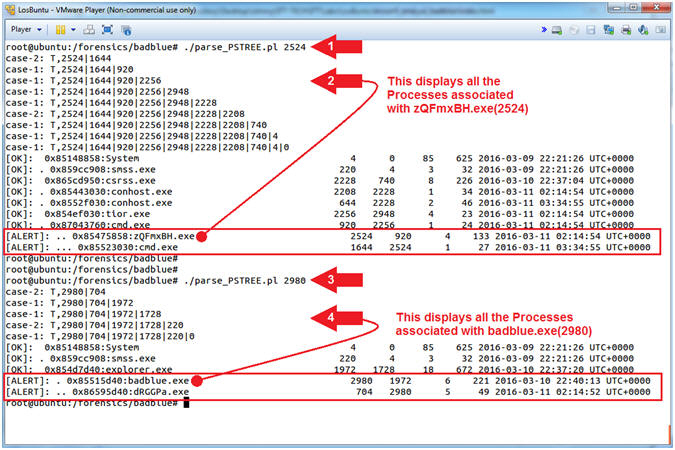
- ./parse_PSTREE.pl 2524
- Notice all the Parent and Child ID associated with 2524
- ./parse_PSTREE.pl 2980
- Notice all the Parent and Child ID associated with 2980
- Note(FYI):
- Command #1,#3, Use (parse_PSTREE.pl) to search the contents of (pstree.txt) for all the Process IDs associated with (2524) and (2980).
- Note(FYI):
| Section 8: Display Network Connections with Volatility (netscan) |
- Display the Network Connections with NETSCAN
- Instructions:
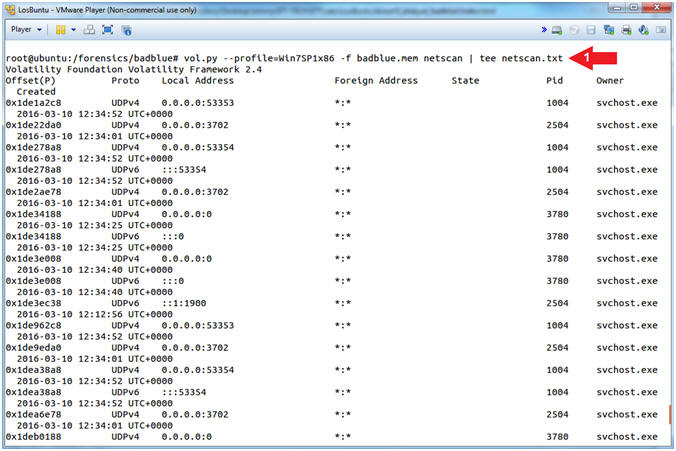
- vol.py --profile=Win7SP1x86 -f badblue.mem netscan | tee netscan.txt
- Note(FYI):
- Command #1, Use (netscan) to scan for network artifacts in 32-bit and 64-bit Windows Vista, Windows 2008 Server and Windows 7 memory dumps. This finds TCP endpoints, TCP listeners, UDP endpoints, and UDP listeners. It distinguishes between IPv4 and IPv6, prints the local and remote IP (if applicable), the local and remote port (if applicable), the time when the socket was bound or when the connection was established, and the current state (for TCP connections only). Use (tee) to display and write standard output to a file (netscan.txt).
- Instructions:
- Analyzing NETSCAN Output
- Note(FYI):
- Replace the Process ID (2524) related to the oddly named executable (zQFmxBH.exe) with your PID found in [Section 6, Step 4]. The executable (zQmxBH.exe) will be named different in your case.
- Replace the Process ID (2980) related to the badblue.exe executable with your PID found in [Section 6, Step 4].
- Instructions:
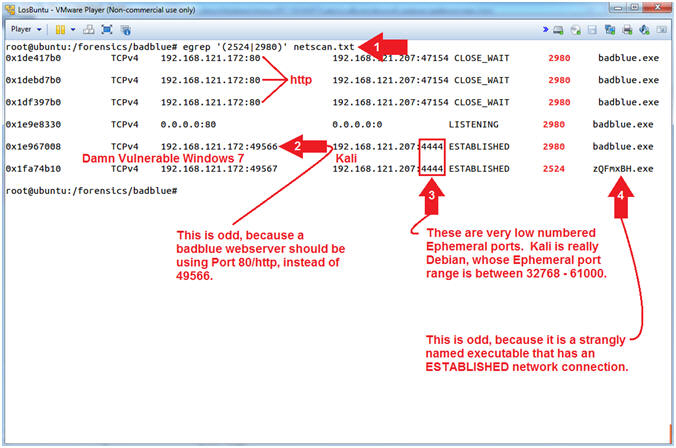
- egrep '(2524|2980)' netscan.txt
- Notice the ESTABLISHED badblue.exe connection.
- Notice the low number Ephemeral Ports (4444).
- Notice the weirdly named executable (zQmxBH.exe)
- Note(FYI):
- Command #1, Use (egrep) to search the file (netscan.txt) for any line that contains PID(2524) or PID(2980).
- Instruction #2, This is a red flag,
because the badblue.exe webserver "should" only
listen on Port 80. In this case, badblue.exe has an
ESTABLISHED connection using an Ephemeral Port.
- Ephemeral Ports are used by the particular operating system for short lived IP communications using either TCP or UDP.
- Instruction #3, this is the inverse situation in which the remote machine (Kali) should be using an Ephemeral Port between 32768 to 61000 to view a webpage. But, instead there are two ESTABLISHED connections on Port 4444. Remember, we attacked badblue.exe using (exploit/windows/http/badblue_passthru) on SESSION 1. Then, we escalated the privilege, using (exploit/windows/local/bypassuac), which is associated with (zQmxBH.exe) in my case.
- Instruction #4, ask yourself this question, why is there an oddly named executable that has an ESTABLISHED connection on a weird looking ephemeral port that is also ESTABLISHED to the same port badblue.exe is using?
- Note(FYI):
| Section 9: Display Process Privileges with Volatility (privs) |
- Display the Process Privileges with PRIVS
- Instructions:
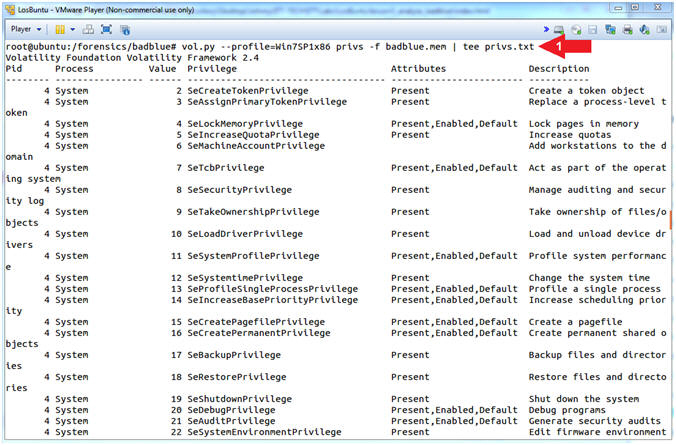
- vol.py --profile=Win7SP1x86 privs -f badblue.mem | tee privs.txt
- Note(FYI):
- Command #1, Use (privs) to show you which process privileges are present, enabled, and/or enabled by default. Use (tee) to display and write standard output to a file (privs.txt).
- Privileges determine the type of system operations that a user account can perform. (Learn More).
- Instructions:
- Search for Enabled Privileges
- Note(FYI):
- Replace the Process ID (2524) related to the oddly named executable (zQFmxBH.exe) with your PID found in [Section 6, Step 4].
- Instructions:
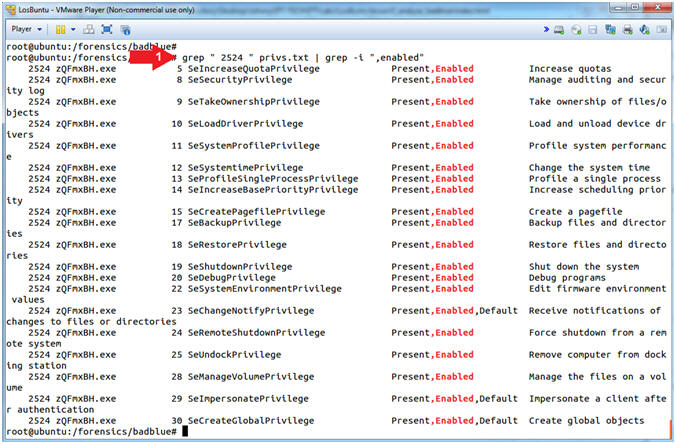
- grep " 2524 " privs.txt | grep -i ",enabled"
- Note(FYI):
- Command #1, Use (grep) to search the file (privs.txt) for the PID string ( 2524 ). Where the ( )represents a white pace. Use (grep -i) to search the results that the first (grep) command produced for the string (,enabled).
- If a privilege is (Enabled) for a particular process then that process has the ability to exercise the actions that come with those privileges.
- For verbose detail surrounding each privilege see Privilege Constants.
- Note(FYI):
- Search for Enabled Privileges with Perl
- Note(FYI):
- Replace the Process ID (2524) related to the oddly named executable (zQFmxBH.exe) with your PID found in [Section 4, Step 4].
- Instructions:
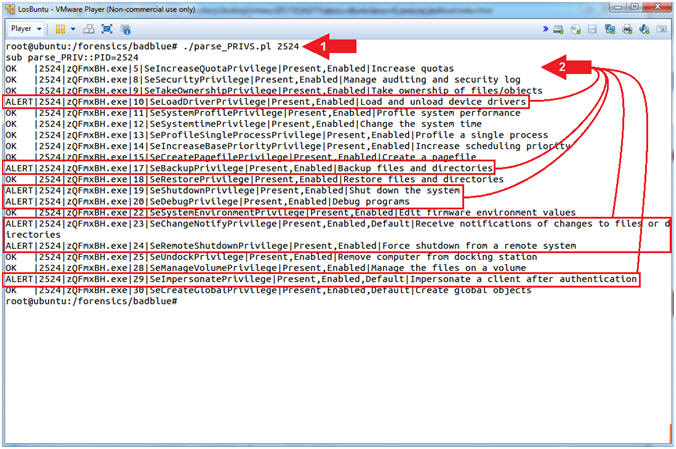
- ./parse_PRIVS.pl 2524
- Notice the ALERTs associated with some of the privileges.
- Note(FYI):
- Command #1, Use (parse_PRIVS.pl) to search the file (privs.txt) for any privileges related to PID (2524).
- According to The Art of Memory
Forensics (Pages 171-172), A forensics investigator should be
most concerned with the following privileges that have explicitly
been enabled.
- SeBackupPrivilege: This grants read access to any file on the file system, regardless of its specified access control list (ACL). Attackers can leverage this privilege to copy locked files.
- SeDebugPrivilege: This grants the ability to read from or write to another process’ private memory space. It allows malware to bypass the security boundaries that typically isolate processes. Practically all malware that performs code injection from user mode relies on enabling this privilege.
- SeLoadDriverPrivilege: This grants the ability to load or unload kernel drivers.
- SeChangeNotifyPrivilege: This allows the caller to register a callback function that gets executed when specific files and directories change. Attackers can use this to determine immediately when one of their configuration or executable files are removed by antivirus or administrators.
- SeShutdownPrivilege: This allows the caller to reboot or shut down the system. Some infections, such as those that modify the Master Boot Record (MBR) don’t activate until the next time the system boots. Thus, you’ll often see malware trying to manually speed up the procedure by invoking a reboot.
- Note(FYI):
| Section 11: Display Security Identifiers with Volatility (getsids) |
- Display the Security Identifiers with GETSIDS
- Instructions:
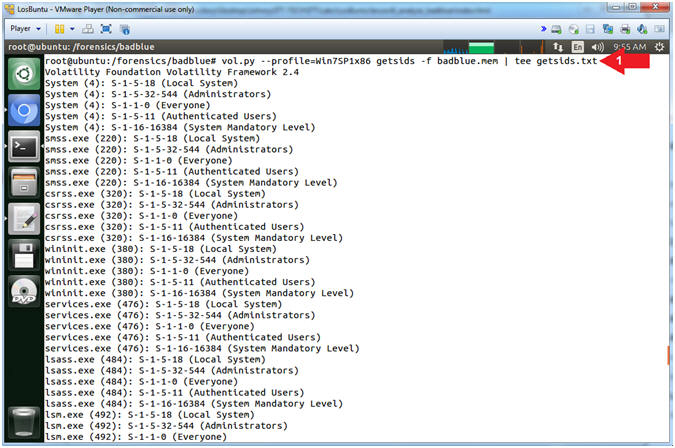
- vol.py --profile=Win7SP1x86 getsids -f badblue.mem | tee getsids.txt
- Note(FYI):
- Command #1, Use (getsids) to view the SIDs (Security Identifiers) associated with a process. This can help you identify processes which have maliciously escalated privileges and which processes belong to specific users.
- Instructions:
- Viewing Security Identifiers (SIDs)
- Note(FYI):
- Replace the Process ID (2524) related to the oddly named executable (zQFmxBH.exe) with your PID found in [Section 6, Step 4]. The executable (zQmxBH.exe) will be named different in your case.
- Replace the Process ID (2980) related to the badblue.exe executable with your PID found in [Section 6, Step 4].
- Instructions:
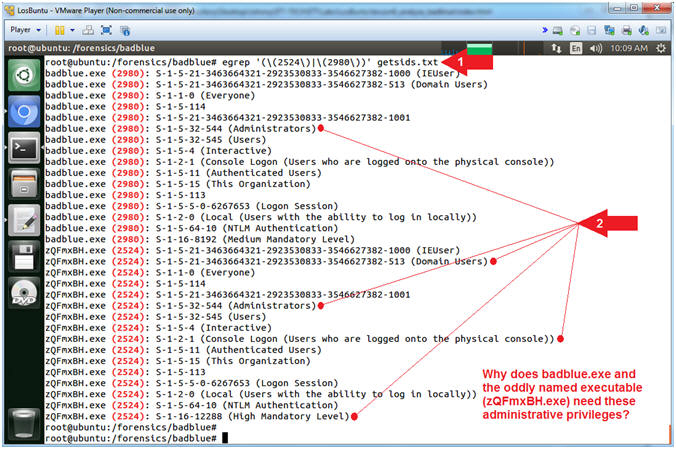
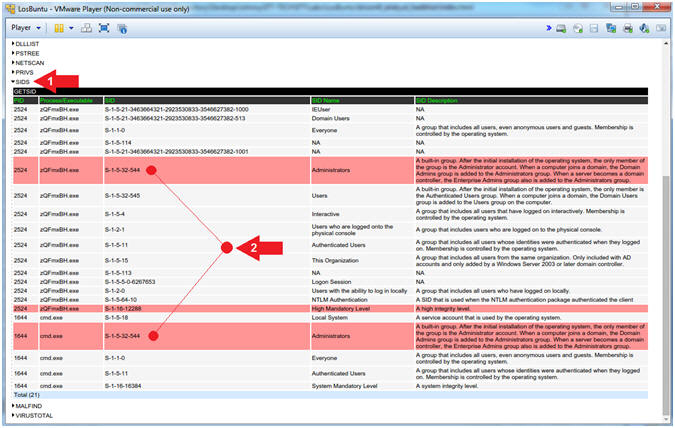
- egrep '(\(2524\)|\(2980\))' getsids.txt
- Note(FYI):
- Command #1, The getsids.txt output
contains Executable name followed by (Process ID) followed by the
Security Identifier. Here we use (egrep) to
search the file (getsids.txt) for any line that contains PID(2524)
or PID(2980).
Furthermore, we need to actually search for each PID
inside of
parenthesis, otherwise egrep might include a SID that contains
either 2524 or 2980. In order to include parenthesis in the search,
we must remove the meaning of the of the parenthesis, which tells
egrep to actually search for the parenthesis along with the PID. By
playing a forward slash \
infront of a parenthesis you remove the parenthesis' meaning to
egrep.
- E.g., S-1-5-80-4176366874-305252471-2256717057-2714189771-3552532790
- E.g., egrep '(\(2524\))' getsids.txt
- GETSIDS tells you what level of access
the attacker had or gained. Below are some of the most commonly attacked SIDs.
- SID Name (Administrators): This is a built-in group. After the initial installation of the operating system, the only member of the group is the Administrator account. When a computer joins a domain, the Domain Admins group is added to the Administrators group. When a server becomes a domain controller, the Enterprise Admins group also is added to the Administrators group.
- SID Name (Domain Users): A global group that, by default, includes all user accounts in a domain. When you create a user account in a domain, it is added to this group by default.
- Red Flags should be going off and you should be asking why does the oddly named executable running out of the Temp directory need SIDs associated with Administrators, Domain Users, or Physical Console Access?
- Reference: The Art of Memory Forensics (Page 170-172)
- Reference: Malware Analyst’s Cookbook (Page 579)
- Command #1, The getsids.txt output
contains Executable name followed by (Process ID) followed by the
Security Identifier. Here we use (egrep) to
search the file (getsids.txt) for any line that contains PID(2524)
or PID(2980).
Furthermore, we need to actually search for each PID
inside of
parenthesis, otherwise egrep might include a SID that contains
either 2524 or 2980. In order to include parenthesis in the search,
we must remove the meaning of the of the parenthesis, which tells
egrep to actually search for the parenthesis along with the PID. By
playing a forward slash \
infront of a parenthesis you remove the parenthesis' meaning to
egrep.
- Note(FYI):
| Section 12: Display Possible Code Injections with Volatility (malfind) |
- Display Possible Code Injections with MALFIND
- Instructions:
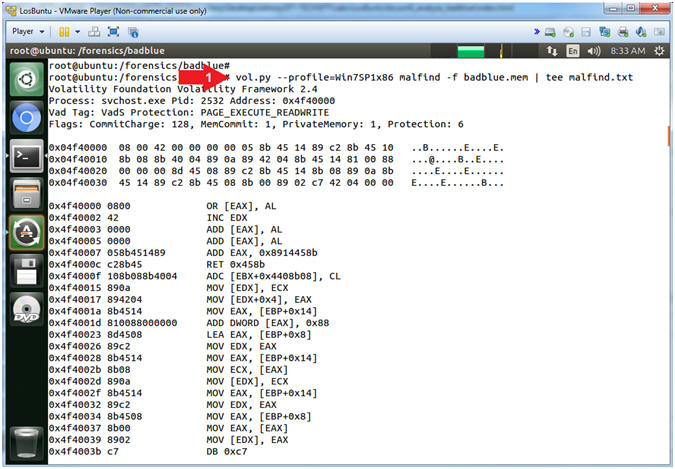
- vol.py --profile=Win7SP1x86 malfind -f badblue.mem | tee malfind.txt
- Note(FYI):
- Command #1, Use (malfind) to help find hidden or injected code/DLLs in user mode memory, based on characteristics such as VAD tag and page permissions. Use (tee) to display and write standard output to a file (malfind.txt).
- Instructions:
- MZ Executable Signature
- Note(FYI):
- Replace the Process ID (2524) related to the oddly named executable (zQFmxBH.exe) with your PID found in [Section 6, Step 4]. The executable (zQmxBH.exe) will be named different in your case.
- Instructions:
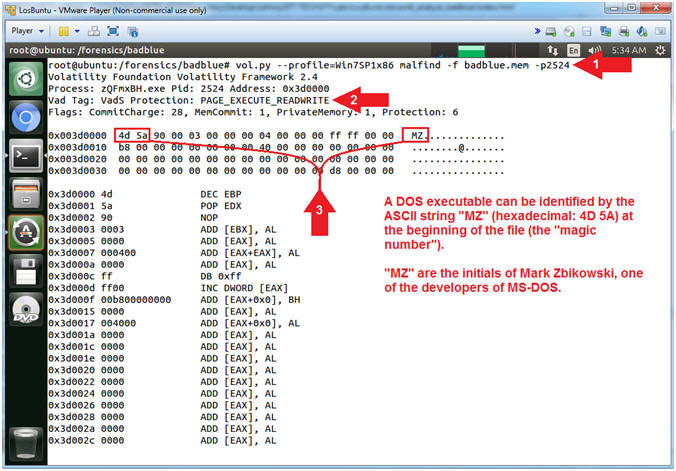
- vol.py --profile=Win7SP1x86 malfind -f badblue.mem -p2524 | head -30
- Notice the VadS Protection
- Notice the MZ Signature
- Note(FYI):
- Command #1, Use (malfind) and the (-pPID) flag to to display only output associated with the oddly named executable (zQmxBH.exe) associated with the Process ID (2524).
- Instruction #2, its' VAD Tag Character has the ability to read, write and execute instructions from its' particular memory location. VAD refers to the Virtual Address Descriptor for the Windows Memory Tree Structure.
- Instruction #3, The DOS MZ executable format is the executable file format used for .EXE files in DOS. The file can be identified by the ASCII string "MZ" (hexadecimal: 4D 5A) at the beginning of the file (the "magic number"). "MZ" are the initials of Mark Zbikowski, one of the developers of MS-DOS.
- Piecing the Puzzle together: Basically, we are confirming that the oddly named executable running out of TEMP with a reverse network connection back to port 4444 is an executable, which so happens to be using both DLLs that are consistent with a Meterpreter session (rsaenh.dll and IPHLPAPI.DLL)
- Note(FYI):
| Section 13: Extract Executable From Memory with Volatility (prodump) |
- Extract Executable From Memory with PROCDUMP
- Note(FYI):
- Replace the Process ID (2524) related to the oddly named executable (zQFmxBH.exe) with your PID found in [Section 6, Step 4]. The executable (zQmxBH.exe) will be named different in your case.
- Instructions:
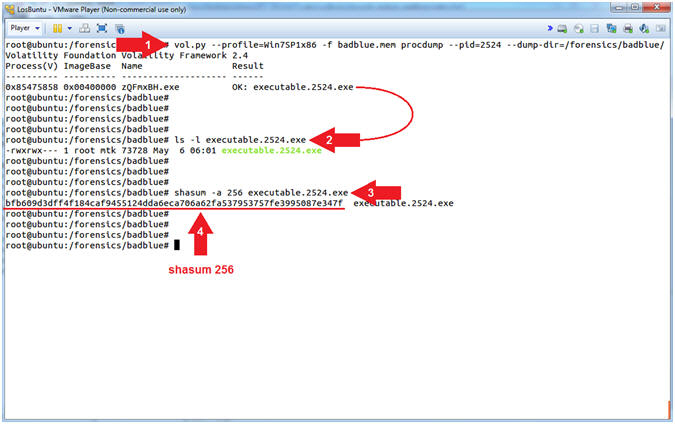
- vol.py --profile=Win7SP1x86 -f badblue.mem procdump --pid=2524 --dump-dir=/forensics/badblue/
- ls -l executable.2524.exe
- shasum -a 256 executable.2524.exe
- View the SHASUM 256 Hash
- Note(FYI):
- Command #1, Use (prodump) to dump a process's executable for a Process ID specified by (--pid=PID), where (--dump-dir=/directory) provides the destination directory of the dumped executable.
- Command #2, Use (ls -l) to view the file (executable.2524.exe) details. E.g., Permissions(-rwxr--r--), Ownerships(root root), Byte Size, etc.
- Command #3, Use (shasum -a 256) to create a SHA 256 check sum of the file (executable.2524.exe).
- Command #4, View the SHA Checksum output.
- Note(FYI):
- Scan Procdump Executable with Virus Total
- Note(FYI):
- This step will not work, unless you completed the prerequisite lesson listed below.
- Replace the Process ID (2524) related to the oddly named executable (zQFmxBH.exe) with your PID found in [Section 6, Step 4]. The executable (zQmxBH.exe) will be named different in your case.
- Instructions:
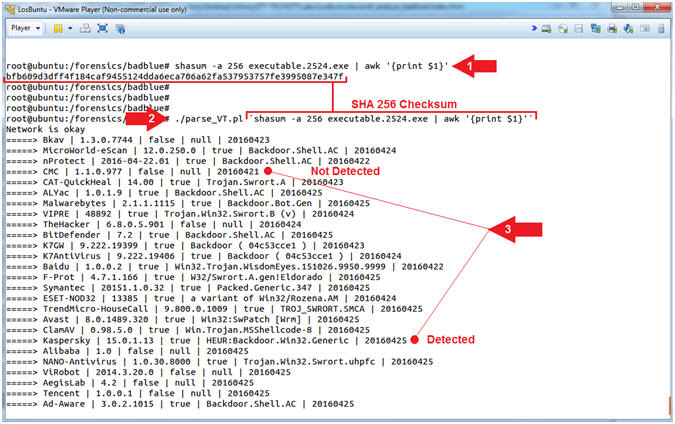
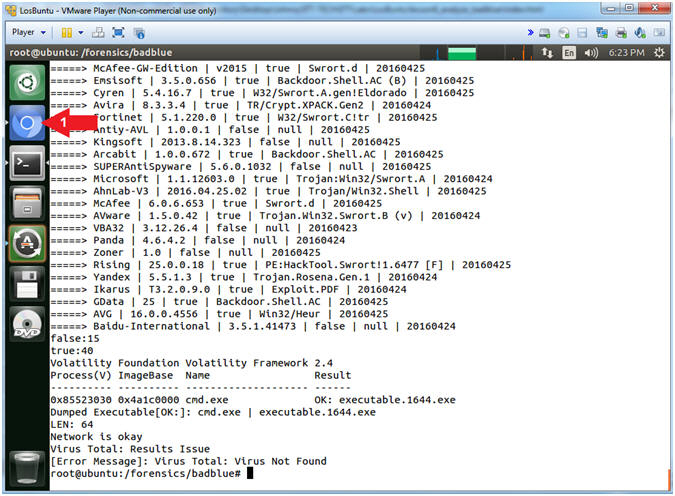
- shasum -a 256 executable.2524.exe | awk '{print $1}'
- ./parse_VT.pl `shasum -a 256 executable.2524.exe | awk '{print $1}'`
- Note(FYI):
- Command #1, Use (shasum) to generate a SHA 256 checksum of the executable (executable.2524.exe) that procdump generated. Use (awk) to cut out the first column (print $1) of the checksum data that is returned from the (shasum) command.
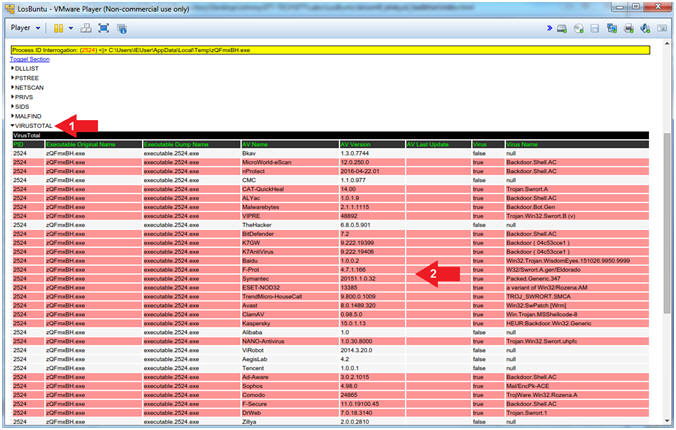
- Command #2, Use (parse_VT.pl) to remotely query VirusTotal to see if the checksum of the of the suspicious executable (executable.2524.exe) that was created by procdump is indeed a Virus.
- Instruction #3, If the third column is equal to false, then the particular scanner checksum database did not find a malicious signature. In the inverse, If the third column is equal to true, then the particular scanner checksum database did find a malicious signature.
- Note(FYI):
| Section 14: Automate Volatility Meterpreter Analysis (find_meterpreter:pl) |
- Automate Volatility Meterpreter Analysis
- Instructions:
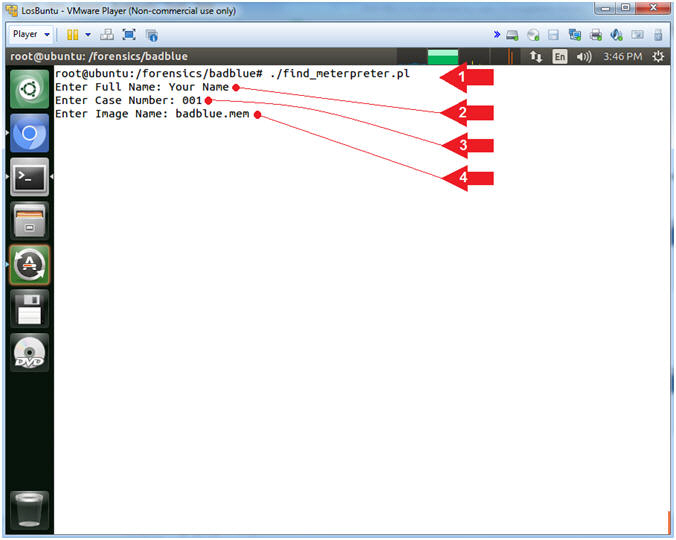
- ./find_meterpreter.pl
- Enter Full Name: Your Name
- Replace the string "Your Name" with your actual name.
- e.g., echo "John Gray"
- Enter Case Number: 001
- Enter Image Name: badblue.mem
- Note(FYI):
- Command #1, (find_meterpreter.pl) was written by Computer Security Student, LLC (Profess0R Shaieb) to automate the parsing and formatting of Volatility data and to help visualize the connecting of the dots. These Perl scripts are meant as teaching aids to help students acquire a programming skillset.
- Instructions:
- Start Chromium Web Browser
- Instructions:
- Click on the Chromium Web Browser Icon

- Click on the Chromium Web Browser Icon
- Instructions:
| Section 15: Volatility Meterpreter BadBlue Report Analysis |
- Basic Report Explanation
- Instructions:
- Navigate to the following report:
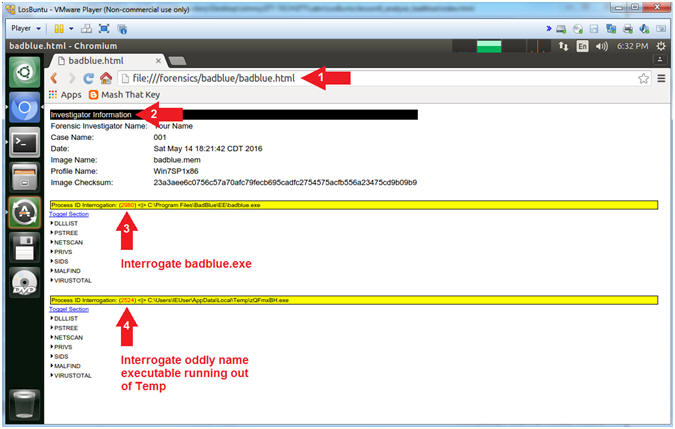
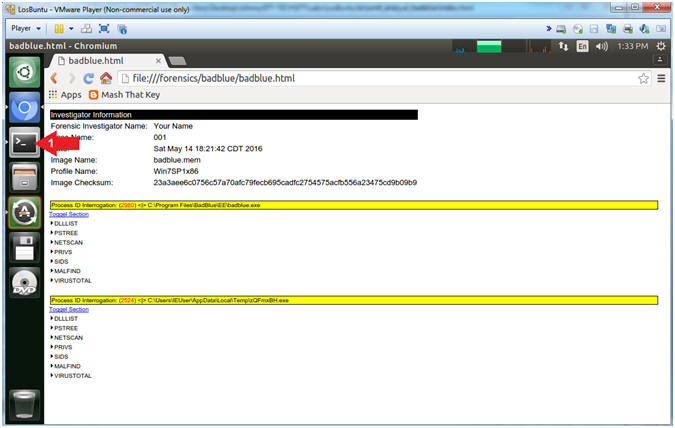
- file:///forensics/badblue/badblue.html
- The Inventory Information section
provides the following information:
- Forensics Investigator Name, (2) Case Name, (3) Date, (4) Image Name, (5) Profile Name, and (6) Image Checksum.
- The Next Section Interrogates the BadBlue executable because it using the following DLLs: (rsaenh.dll) and/or (IPHLPAPI.DLL).
- The Next Section Interrogates the Oddly Named executable because it using the following DLLs: (rsaenh.dll) and/or (IPHLPAPI.DLL).
- Navigate to the following report:
- Note(FYI):
- Remember that we are searching for possible Meterpreter sessions, because it's injection signature has been know to use (rsaenh.dll) and (IPHLPAPI.DLL). In addition, both badblue.exe and the oddly named (zQmxBH.exe) are not in our white list.
- Instructions:
- BadBlue Analysis (Part 1)
- Note(FYI):
- Replace the Process ID (2980) related to the badblue.exe executable with your PID found in [Section 6, Step 4].
- In your case, (dRGGPa.exe[704]) will be name differently with a different PID.
- Instructions:
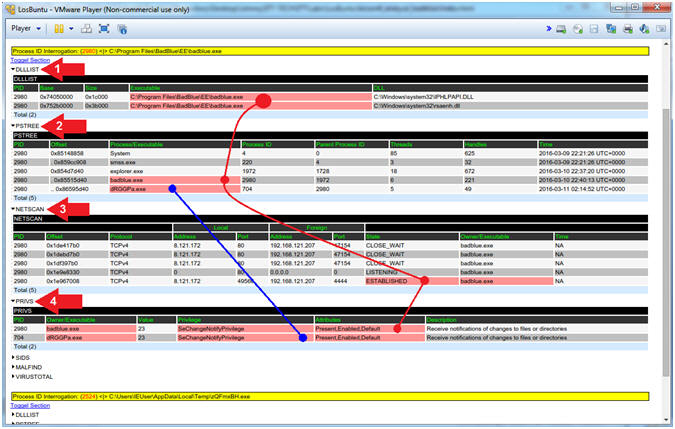
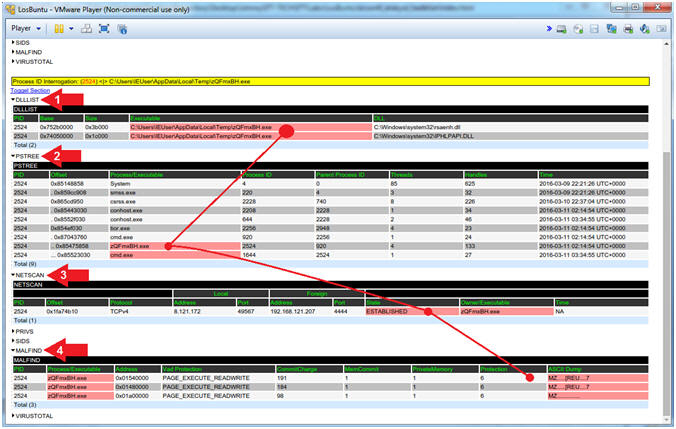
- Click on the DLLLIST arrow (
 )
) - Click on the PSTREE arrow ()
- Click on the NETSCAN arrow ()
- Click on the PRIVS arrow ()
- Click on the DLLLIST arrow (
- Note(FYI):
- Red Dot Analysis (badblue.exe[2980]), badblue.exe was flagged because it is using (rsaenh.dll) and/or (IPHLPAPI.DLL), which is seen in DLLLIST. In PSTREE, you can see that badblue.exe is the Parent ID of another oddly named executable (dRGGPa.exe[704]), which is the stager associated with the badblue exploit (exploit/windows/http/badblue_passthru). In NETSCAN, notice that (badblue.exe[2980]) has ESTABLISHED a TCP connection back to Kali(192.168.121.207) over Port/4444. In PRIVS, notice that SeChangeNotifyPrivilege is turned on by (default, present and enabled) which allows the caller/attacker to register a callback function that gets executed when specific files and directories change.
- Blue Dot Analysis (dRGGPa.exe[704]). In PSTREE, notice that dRGGPa.exe is a Child Process of (badblue.exe[2980]). In PRIVS, it also has SeChangeNotifyPrivilege turned on by (default, present and enabled). Nothing running out of Temp should ever have this privilege to alert somebody if a file or directory changes.
- Reference: The Art of Memory Forensics (Page 170-172)
- Note(FYI):
- BadBlue Analysis (Part 2)
- Instructions:
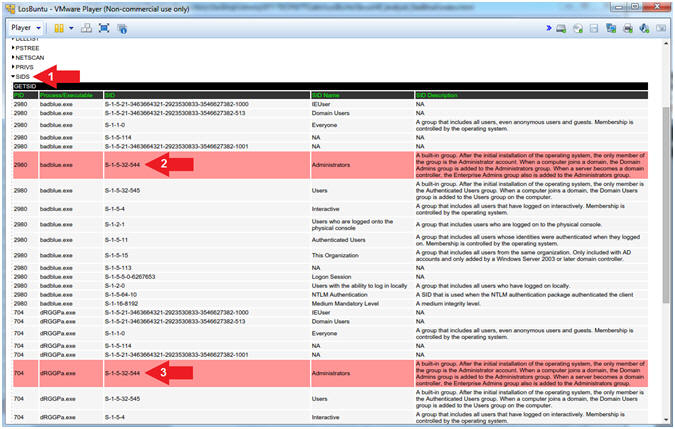
- Click on the SIDS arrow ()
- Notice the SID (S-1-5-32-544) associated with (badblue.exe[2980])
- Notice the SID (S-1-5-32-544) associated with (dRGGPa.exe[704])
- Click on the SIDS arrow (
- Note(FYI):
- SID (S-1-5-32-544) Analysis. The BadBlue executable is attached to an Administrator owned Security Identifier. This is a big problem, because, once exploited, the attacker owns the machine. Notice that (badblue.exe[2980]) spawned a child (dRGGPa.exe[704]) that also belongs to the Administrators Security Identifier.
- Possible Remediation:
- Never install a public utility like a Webserver with Administrator Privileges.
- Obviously, thorough regression and penetration testing is required for any public utility that might be susceptible to buffer overflows.
- Instructions:
- BadBlue Analysis (Part 3)
- Instructions:
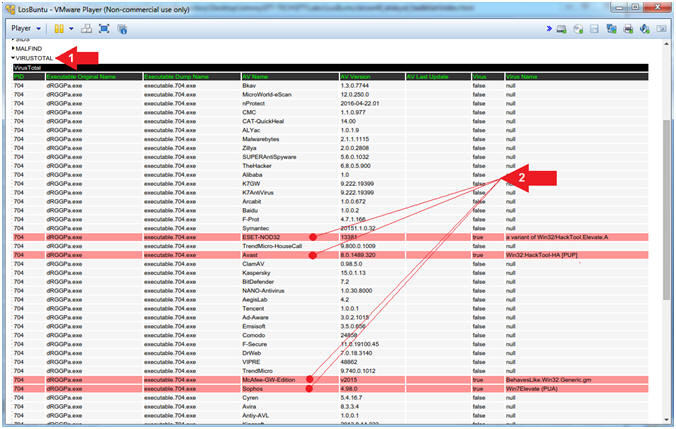
- Click on the VIRUSTOTAL arrow ()
- Notice that several Anti-Virus Vendors associate (dRGGPa.exe[704]) with a positive Malware identification.
- Click on the VIRUSTOTAL arrow (
- Instructions:
| Section 16: Volatility Meterpreter bypassuac Report Analysis |
- bypassuac Analysis (Part 1)
- Note(FYI):
- My Process ID (2524) is related to the oddly named executable (zQFmxBH.exe) which is found in [Section 6, Step 4].
- In a previous lesson, we escalated the privilege, using (exploit/windows/local/bypassuac), which is associated with (zQmxBH.exe) in my case.
- Instructions:
- Click on the DLLLIST arrow ()
- Click on the PSTREE arrow ()
- Click on the NETSCAN arrow ()
- Click on the MALFIND arrow ()
- Click on the DLLLIST arrow (
- Note(FYI):
- Red Dot Analysis (badblue.exe[2980]). (zQmxBH.exe) was flagged because it is using (rsaenh.dll) and/or (IPHLPAPI.DLL), which is seen in DLLLIST. In PSTREE, we can see that (zQmxBH.exe) spawned a child process (cmd.exe) which is part of the post exploit(bypassuac). In NETSCAN, notice that oddly named process (zQmxBH.exe) that is running out of Temp, which also has an ESTABLISHED TCP connection back to Kali(192.168.121.207) over Port/4444. MALFIND, also flagged (zQmxBH.exe), because of its' VAD Tag Character has the remote ability to read, write and execute instructions from its' particular memory location. In addition, you can see that (zQmxBH.exe) has the presence of the MZ executable signature.
- In summary, this is an executable running out of Temp that is using both using (rsaenh.dll) and (IPHLPAPI.DLL), which has a remote connection back to somewhere else.
- Note(FYI):
- bypassuac Analysis (Part 2)
- Instructions:
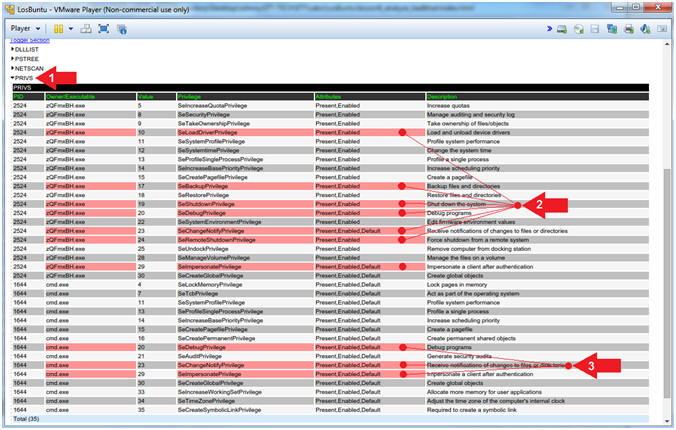
- Click on the PRIVS arrow ()
- Notice the privileges associated with (zQmxBH.exe).
- Notice the privileges associated with (cmd.exe).
- Click on the PRIVS arrow (
- Note(FYI):
- Instruction #2, Ask yourself why this oddly named executable has the privilege (ie., ability) to remotely shutdown (SeShutdownPrivilege) the machine or has the ability to load and unload device drivers (SeLoadDriverPrivilege).
- Instruction #3, We should already be concerned by this cmd.exe process, because it was spawned from (zQmxBH.exe). Ask yourself why it needs to Receive notifications of changes to files or directories (SeChangeNotifyPrivilege) or to impersonate a client after authentication (SeImpersonatePrivilege).
- Instructions:
- bypassuac Analysis (Part 3)
- Instructions:
- Click on the SIDS arrow ()
- Notice the Security Identifiers associated with (zQmxBH.exe) and (cmd.exe).
- Click on the SIDS arrow (
- Note(FYI):
- Instruction #2, Why would both the oddly named executable (zQmxBH.exe) running out of Temp and it's child process (cmd.exe) need to have or belong to the Administrator Security Identifier.
- Instructions:
- bypassuac Analysis (Part 4)
- Instructions:
- Click on the VIRUSTOTAL arrow ()
- Notice the positive Malware Identifications associated with (zQmxBH.exe).
- Click on the VIRUSTOTAL arrow (
- Note(FYI):
- Instruction #2, In summary, the oddly named executable (zQmxBH.exe) (1) running out of Temp (2) with an ESTABLISHED TCP connection back to Kali (3) over a low number Ephemeral Port/4444 (4) with High-Level Privileges and (5) an Administrative Security Identifier is (6) positively identified as Malware by numerous Anti-Virus Vendors.
- Instructions:
| Section 17: Bonus Section (Using MimiKatz) |
- Open Terminal Windows
- Instructions:
- Click on the Terminal Window
- Click on the Terminal Window
- Note(FYI):
- Command #1, Clicking on the Terminal Window icon will display your previous Terminal Window, if you already did not close it.
- Instructions:
- Volatility MimiKatz Plugin
- Note(FYI):
- Mimikatz is a tool that pulls plain-text passwords out of WDigest interfaced through LSASS. WDigest is a DLL first added in Windows XP that is used to authenticate users against the HTTP Digest authentication and Simple Authentication Security Layer (SASL) exchanges. Both of these require the user's plain-text password in order to derive the key to authenticate, thus why it is stored in plain-text.
- Instructions:
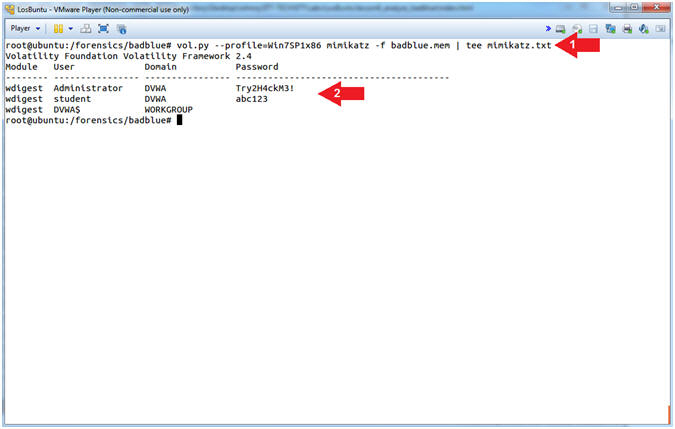
- vol.py --profile=Win7SP1x86 mimikatz -f badblue.mem | tee mimikatz.txt
- Notice the clear text passwords
- Note(FYI):
- Command #1, Use (mimikatz) to display both the usernames and passwords of anybody logged onto Damn Vulnerable Windows 7 at the time the image was captured.
- Instruction #2, From Windows XP to Window 2K8 Server, clear text passwords of logged in users are stored in memory even if they are using Active Directory.
- Note(FYI):
| Section 18: Proof of Lab |
- Proof of Lab
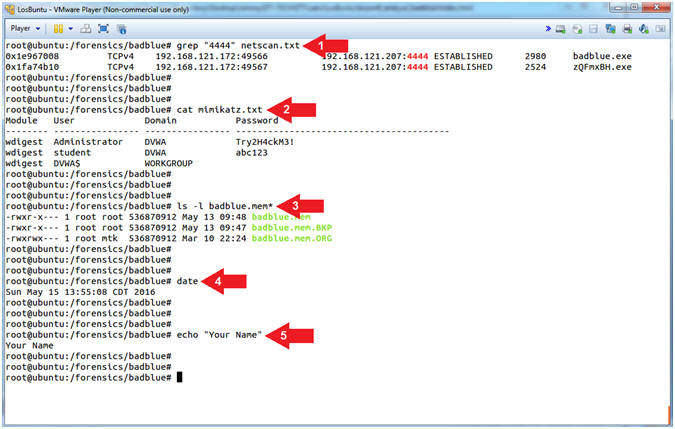
- Instructions:
- grep "4444" netscan.txt
- cat mimikatz.txt
- ls -l badblue.mem*
- date
- echo "Your Name"
- Replace the string "Your Name" with your actual name.
- e.g., echo "John Gray"
- Note(FYI):
- Command #1, Use (grep) to search for the string(4444) in the file (netscan.txt).
- Command #2, Use (cat) to display the content of file (mimikatz.txt)
- Command #3, Use (ls -l) to display the file details of all the badblue.mem images.
- Proof of Lab Instructions:
- Do a PrtScn
- Paste into a word document
- Upload to Moodle
- Instructions: